Power BI is a powerful tool for data visualization and analysis, but navigating through its various features and functionalities can sometimes be time-consuming. To enhance your productivity and make your workflow more efficient, Power BI offers several keyboard shortcuts. Whether you’re cleaning data, building visualizations, or customizing reports, these shortcuts can save you time and effort.
Continue readingMonthly Archives: October 2024
How to Convert Degree Minute Second (DMS) to Latitude and Longitude in Tableau
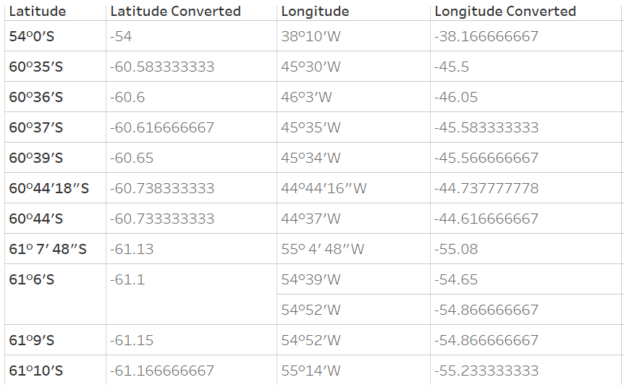
Geographic data is often stored in a Degree-Minute-Second (DMS) format, making it a bit tricky to convert into the standard decimal degrees (DD) required for Tableau’s mapping functions. In this post, I’ll walk you through how to transform DMS coordinates to decimal degrees directly in Tableau, step-by-step, so you can plot your geographic data without headaches.
Continue readingHow to add Current DateTime as New Column to Fabric Lakehouse using Notebook PySpark
In this post, I’ll explain how to add the current date and time to an existing PySpark DataFrame in a Fabric Notebook. This is particularly helpful when inserting data into a Fabric Lakehouse table, as it allows you to track when each record was added. I’ll walk through an example using a DataFrame to first load some sample data and show how to append a new column with the current timestamp to capture the insertion time.
Continue readingThe Complete Likert Scale and NPS Power BI Tutorial
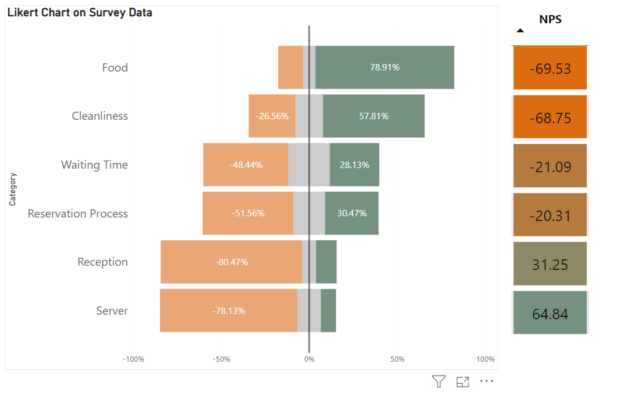
If you’ve read my previous tutorial on creating Likert Scale and NPS scores in Tableau, you might have found yourself wondering: how can I achieve the same in Power BI? The good news is, Power BI offers a straightforward way to replicate this process while leveraging its powerful visualization and data modeling features.
Continue reading