
When working with data in Power BI, summarizing and grouping data is essential for gaining insights and preparing reports. These operations allow you to aggregate values, perform calculations, and create custom tables or visuals based on specific grouping conditions.
In this blog, we’ll explore how to use SUMMARIZE and GROUPBY in Power BI, with practical examples using the Superstore dataset.
What is SUMMARIZE in Power BI?
The SUMMARIZE function in Power BI creates a summary table by grouping data and performing aggregations. It’s highly versatile and commonly used in measures, calculated tables, or variables.
SUMMARIZE(
    table,
    grouping_column1, grouping_column2, ...,
    [name_of_aggregation1, aggregation_expression1],
    [name_of_aggregation2, aggregation_expression2],
    ...
)- table: The table to summarize.
- grouping_columns: Columns used for grouping.
- name_of_aggregation: Name of the calculated field.
- aggregation_expression: Aggregation formula (e.g., SUM, AVERAGE).
Let’s put it into practice. First, import the data set into Power BI. To do so, go to the Home tab > Get Data. Select where you stored superstore dataset and load it.
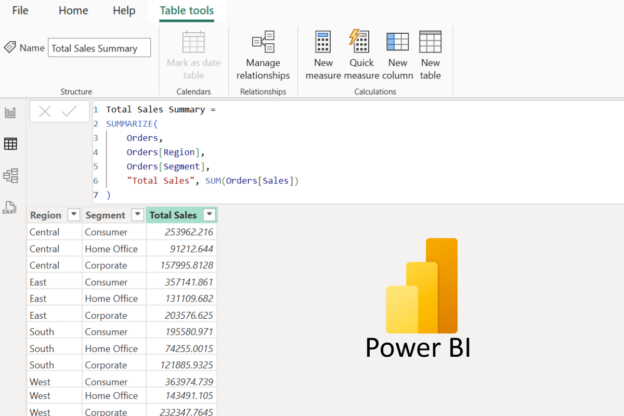
I have more columns than needed. What I want is is calculate total sales grouped by Region and Segment from the Superstore dataset.
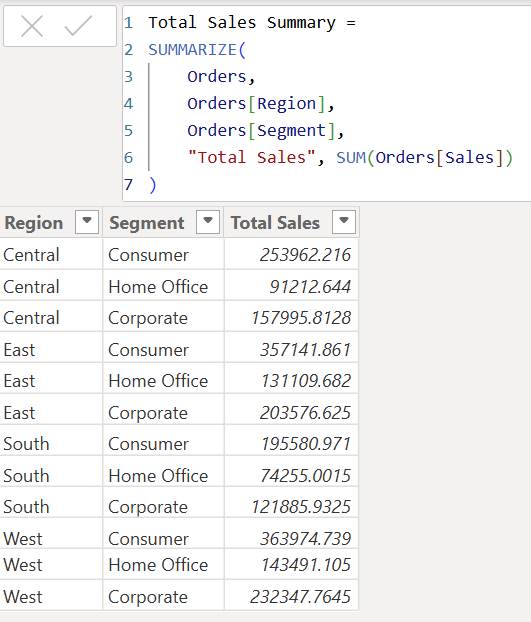
Total Sales Summary =
SUMMARIZE(
    Orders,
    Orders[Region],
    Orders[Segment],
    "Total Sales", SUM(Orders[Sales])
)
Explanation:
- SUM(Orders[Sales]) computes total sales for each Region-Segment combination.
- Orders[Region] and Orders[Segment] are the grouping columns.
- “Total Sales” is a calculated column name.
Below is the output:
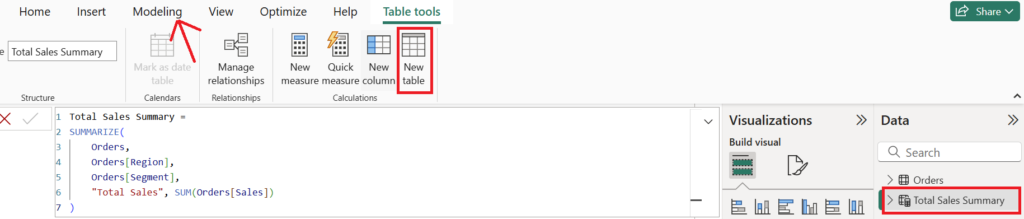
You can then visualize this summary in Power BI by creating a Table or Matrix visual and referencing the calculated table.
Using SUMMARIZE with ROLLUP
The ROLLUP feature within SUMMARIZE adds subtotal rows to your summary tables to show subtotals across different grouping levels and provide more detailed hierarchical summaries. If you work in the finance field or any relevant analysis role, this would be particularly useful for performing multi-level aggregations.
SUMMARIZE(
    table,
    ROLLUP(grouping_column1, grouping_column2, ...),
    [name_of_aggregation, aggregation_expression]
)- ROLLUP creates subtotals for each grouping column and a grand total for the entire dataset.
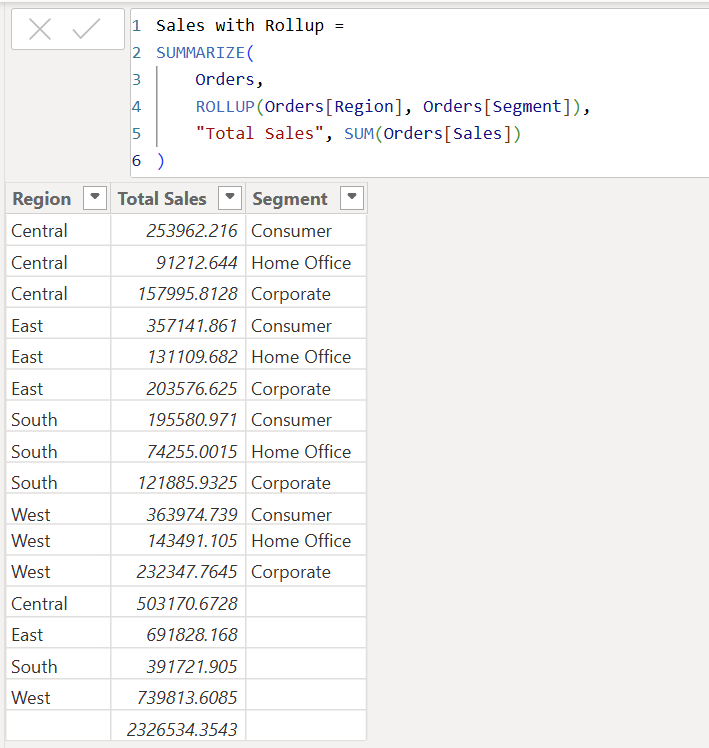
For example, built on from the previous summary table, I want to calculate Sales by Region and Segment with Subtotals.
Sales with Rollup =
SUMMARIZE(
    Orders,
    ROLLUP(Orders[Region], Orders[Category]),
    "Total Sales", SUM(Orders[Sales])
)
Here is the new table:
Use Case: Why Use ROLLUP?
ROLLUP is perfect for creating reports that require:
- Hierarchical Totals: Subtotals for each grouping level.
- Grand Totals: One final summary row for the entire dataset.
Adding ADDCOLUMNS to SUMMARIZE
ADDCOLUMNS is used to enhance the summary table by adding custom calculated columns. This allows you to dynamically compute values like percentages, ratios, or margins within the grouped results.
ADDCOLUMNS(
    SUMMARIZE(table, grouping_column1, grouping_column2, ...),
    "New Column Name", calculation_expression
)- SUMMARIZE: Generates the base summary table.
- ADDCOLUMNS: Adds calculated fields dynamically to the summarized output.
Now, let’s enhance the summary table to include Profit Margin.
Sales and Profit Margin =
ADDCOLUMNS(
    SUMMARIZE(
        Orders,
        Orders[Region],
        Orders[Segment],
        "Total Sales", SUM(Orders[Sales]),
        "Total Profit", SUM(Orders[Profit])
    ),
    "Profit Margin", DIVIDE([Total Profit], [Total Sales], 0)
)
The new table shows profit margin.
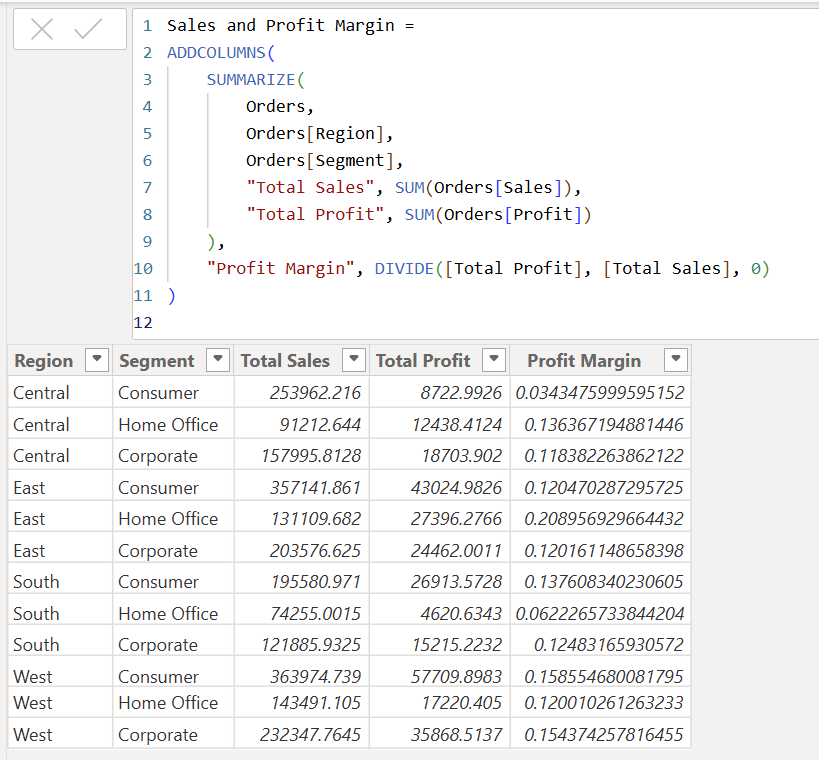
Explanation:
- SUMMARIZE generates the base table with Total Sales and Total Profit.
- ADDCOLUMNS adds the Profit Margin as a calculated column.
Use Case: Why Use ADDCOLUMNS ?
ADDCOLUMNS is ideal when:
- Dynamic Calculations Are Needed: Add fields like profit margin, growth rate, or custom metrics.
- Enriching Summarized Tables: Enhance the base summary with meaningful metrics.
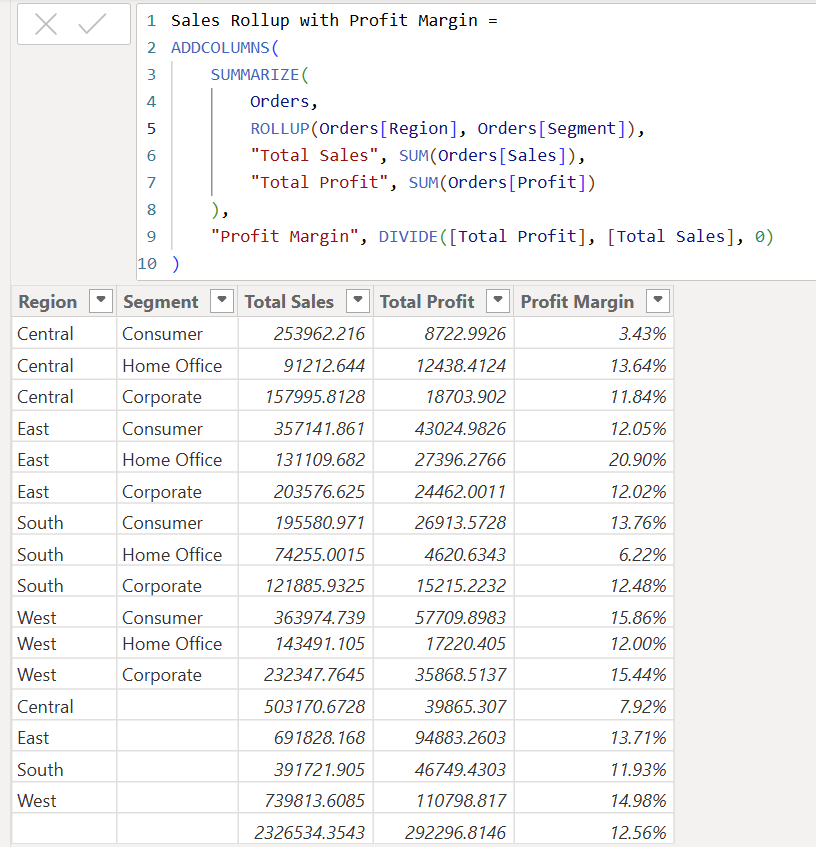
Bonus: Combining ROLLUP and ADDCOLUMNS
You can combine ROLLUP and ADDCOLUMNS to create hierarchical summaries with custom calculations.
Sales Rollup with Profit Margin =
ADDCOLUMNS(
    SUMMARIZE(
        Orders,
        ROLLUP(Orders[Region], Orders[Segment]),
        "Total Sales", SUM(Orders[Sales]),
        "Total Profit", SUM(Orders[Profit])
    ),
    "Profit Margin", DIVIDE([Total Profit], [Total Sales], 0)
)
What is GROUPBY in Power BI?
The GROUPBY function also creates a grouped summary but is more specific compared to SUMMARIZE. While SUMMARIZE allows for multiple aggregations in one step, GROUPBY requires you to explicitly define aggregations using CURRENTGROUP.
GROUPBY(
    table,
    grouping_column1, grouping_column2, ...,
    aggregation_expression
)- CURRENTGROUP: A special keyword to reference the current group when performing calculations.
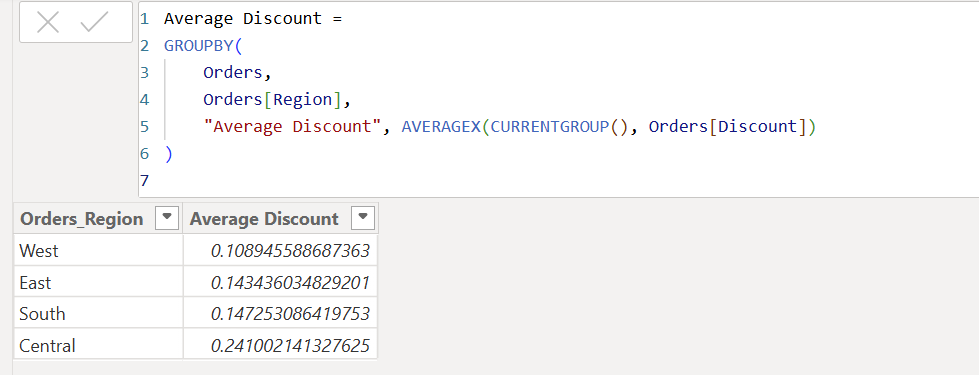
This time, let’s use GROUPBY function to compute the average discount grouped by Region.
Average Discount =
GROUPBY(
    Orders,
    Orders[Region],
    "Average Discount", AVERAGEX(CURRENTGROUP(), Orders[Discount])
)
Explanation:
- Orders[Region] groups the data by region.
- “Average Discount” is the name of the calculated field.
- AVERAGEX(CURRENTGROUP(), Orders[Discount]) computes the average discount for each region.
Below is the output:
When to Use SUMMARIZE vs. GROUPBY
| Feature | SUMMARIZE | GROUPBY |
|---|---|---|
| Flexibility | Allows multiple aggregations in one step | Focuses on one aggregation at a time |
| Ease of Use | More intuitive for creating grouped summaries | Requires CURRENTGROUP for aggregations |
| Performance | Slightly more optimized for multiple calculations | Better for simpler calculations |
| Typical Use Case | Summary tables, multiple measures | Advanced scenarios, custom calculated columns |
Conclusion
Both SUMMARIZE and GROUPBY are invaluable tools in Power BI for grouping and summarizing data. While SUMMARIZE is user-friendly and flexible, GROUPBY provides precise control over grouped calculations. By mastering these functions, you can unlock new levels of analytical power in Power BI, enabling you to create detailed and insightful reports.
Try applying these techniques with the Superstore dataset to practice and improve your Power BI skills!