
In a previous post about how to use Tableau Exclude LOD in Power BI, we briefly mentioned ALLSELECTED. However, ALLSELECTED is a more powerful and complex function than we covered at that time. In this article, we’ll delve deeper into not only ALLSELECTED but also its counterpart, ALL, to fully understand their capabilities and applications in Power BI.
The ALL Function: Removing Filters Entirely
What Does ALL Do?
The ALL function removes all filters from a column, table, or set of columns. It resets the context to include all rows, regardless of slicers, visuals, or other filters.
Example 1: Calculating Total Sales Ignoring Filters
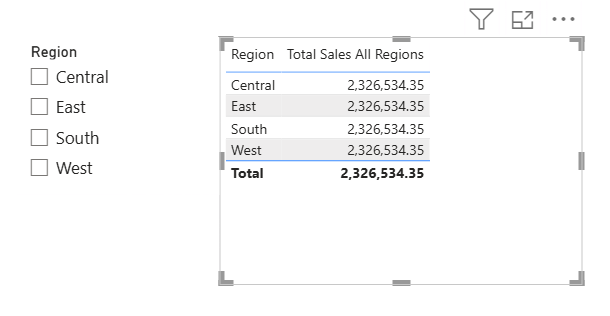
Suppose you want to show total sales across all regions, even when a user selects specific regions in a slicer.
DAX Measure:
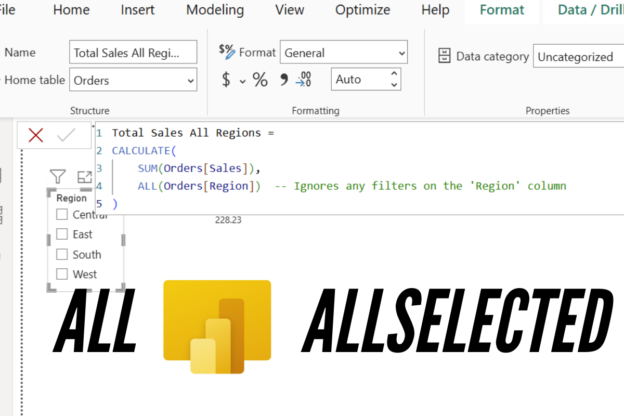
Total Sales All Regions =
CALCULATE(
    SUM(Superstore[Sales]),
    ALL(Superstore[Region])  -- Ignores any filters on the 'Region' column
)
If a user selects “East” and “West” in a slicer, this measure will still display the sum of sales across all regions as below.
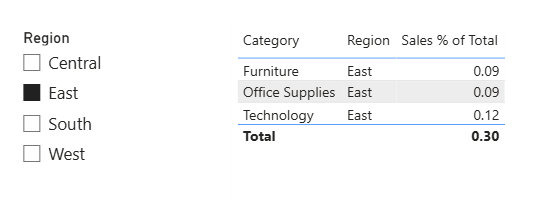
Example 2: Calculating Percent of Total Sales
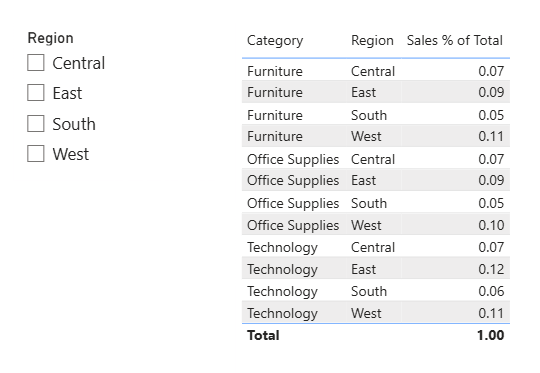
To compute a category’s sales as a percentage of total sales (ignoring filters):
Sales % of Total =
DIVIDE(
    SUM(Superstore[Sales]),
    CALCULATE(SUM(Superstore[Sales]), ALL(Superstore))  -- Removes all filters
)
This measure shows each category’s contribution to the grand total, even if other filters (e.g., year, region) are applied.
The ALLSELECTED Function: Respecting User Selections
What Does ALLSELECTED Do?
The ALLSELECTED function retains the filter context from user interactions (e.g., slicers, cross-filtering) while ignoring filters from the immediate visual context. It’s often used in scenarios where you want calculations to respect “external” selections but ignore “internal” filters.
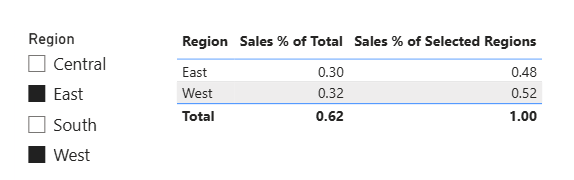
Example 1: Dynamic Percentage of Selected Regions
Imagine a report where users select regions via a slicer. You want to show each region’s sales as a percentage of the selected regions’ total sales.
DAX Measure:
Sales % of Selected Regions =
DIVIDE(
    SUM(Superstore[Sales]),
    CALCULATE(
        SUM(Superstore[Sales]),
        ALLSELECTED(Superstore[Region])  -- Respects slicer selections
    )
)
If a user selects “East” and “West,” the denominator becomes the sum of these two regions, and each row in a table visual will show its contribution to this subset.
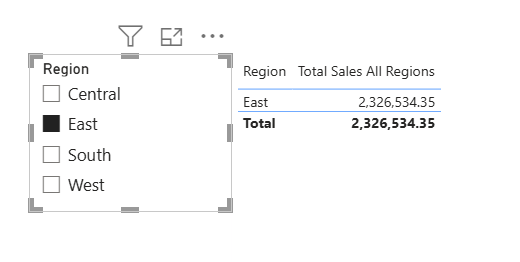
In this screenshot, the ALL measure on the left ignores filter while the ALLSELECTED measure on the right respect filter.
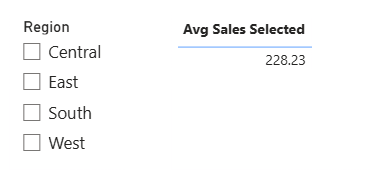
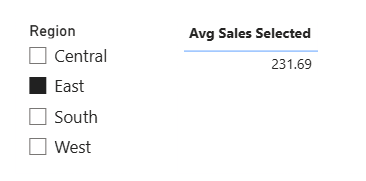
Example 2: Comparing Selected vs. Total
To highlight how selected regions perform against the overall average:
Avg Sales Selected =
CALCULATE(
    AVERAGE(Superstore[Sales]),
    ALLSELECTED(Superstore[Region])  -- Retains slicer context
)
Average sales across all regions when no specific region is selected:
When East region is selected:
Key Differences Between ALL and ALLSELECTED
| Scenario | ALL | ALLSELECTED |
|---|---|---|
| Filter Removal | Removes all filters. | Removes “inner” filters but keeps user selections. |
| Use Case | Grand totals, percentages of entire dataset. | Dynamic totals based on slicers, rankings within selections. |
| Interaction with Slicers | Ignores slicers entirely. | Respects slicer selections. |
| Performance Impact | Generally faster. | Potentially slower with complex contexts. |
Common Pitfalls and Tips
- Misunderstanding Context:
- ALL resets all filters on the specified columns/tables.
- ALLSELECTED is context-dependent; it behaves differently in visuals vs. slicers. Test iteratively!
- Nested Contexts:
When used inside nested CALCULATE statements, ALLSELECTED can behave unexpectedly. - Performance:
Overusing ALLSELECTED in large datasets may slow down your report. Optimize by limiting its scope (e.g., ALLSELECTED(Column) instead of ALLSELECTED(Table)).
When to Use Each Function
- Use ALL when:
- Calculating grand totals.
- Creating rankings unaffected by filters.
- Resetting context in time intelligence calculations (e.g., YTD vs. PYTD).
- Use ALLSELECTED when:
- Building dynamic dashboards that respect slicers.
- Computing percentages relative to user-selected values.
- Comparing subsets against filtered benchmarks.
Conclusion
Both ALL and ALLSELECTED are powerful tools for manipulating filter context in DAX. While ALL provides a “clean slate” by removing filters, ALLSELECTED offers nuanced control by preserving user selections. By applying these functions to the Superstore dataset—whether calculating unfiltered totals or dynamic percentages—you can create more flexible and user-friendly Power BI reports.