
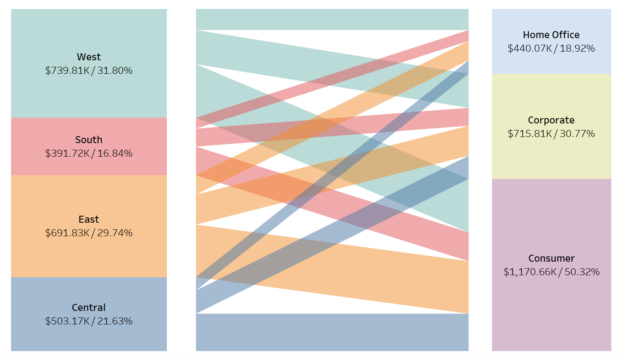
Parallel sets are a visually striking way to represent flows and relationships between categories, offering deeper insights into complex data distributions. In this blog, we’ll guide you step by step on how to create a parallel set visualization in Tableau using the Sample Superstore dataset.
Step 1: Load and Prepare the Data
Load the Dataset
- Open Tableau Desktop or Tableau Public.
- If using Tableau Desktop, connect to the Sample – Superstore data source.
- If using Tableau Public, download and load the dataset.
Add Path Data
- Right-click the data source and select Edit Data Source.
- In the Data Source Editor, open the relationship model, paste the following Path
Path
1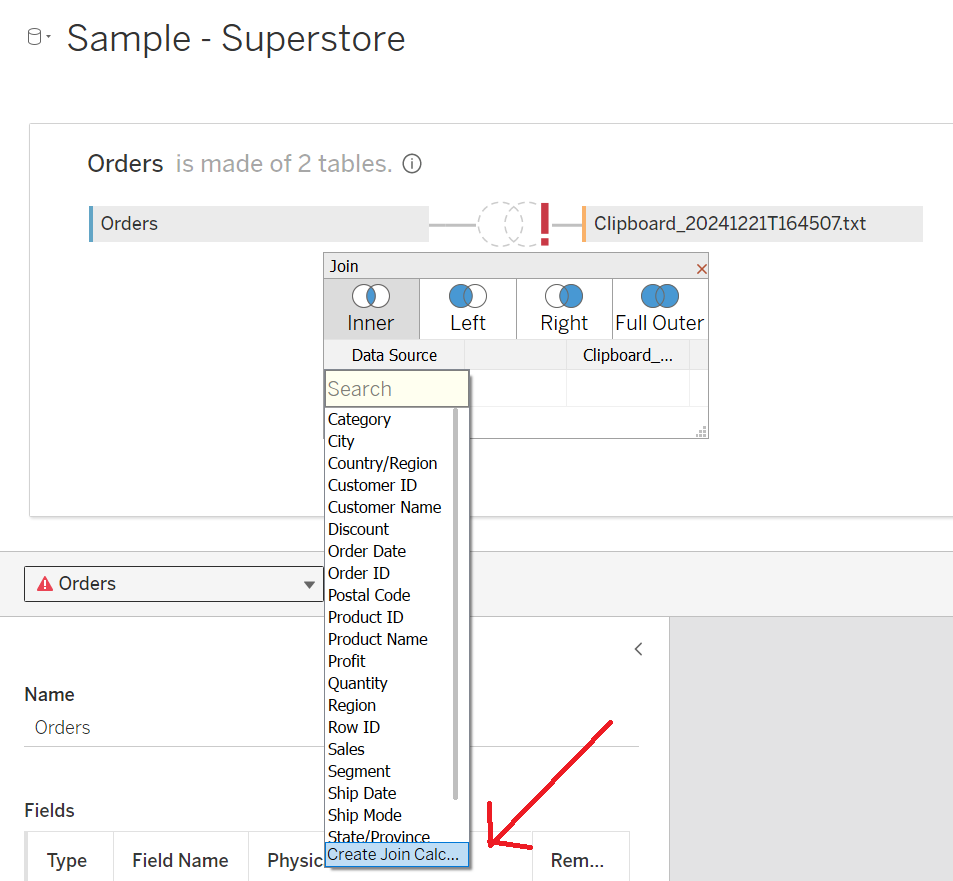
4- You may get an error as there is no joining column, so we need to create one:
- Click Add New Join Clause, select Create Join Calculation, type
1, and click OK. - Repeat this for the right-hand side of the join.
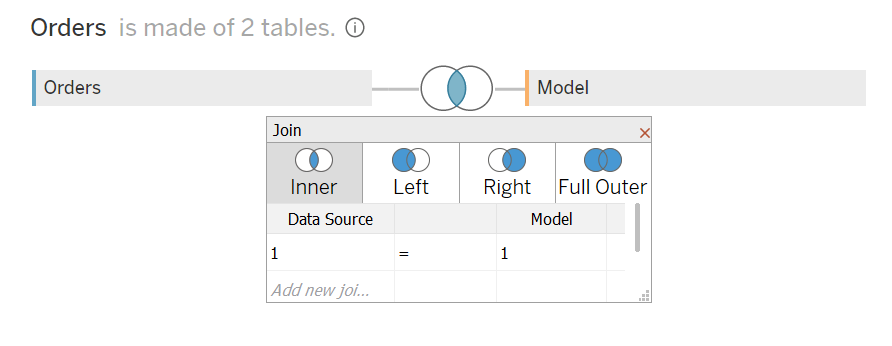
- Click Add New Join Clause, select Create Join Calculation, type
- Ensure that the join type is set to Inner Join.
Step 2: Create Parameters and Calculated Fields
Create Parameters
- @Color Dimension
- Data Type: String
- Allowable Values: List
- Add:
RegionandSegment
- Add:
- Current Value: Segment
Create Calculated Fields
- Path (bin)
- Right-click Path, select Create > Bins.
- In the Edit Bins window:
- New Field Name: Path (bin)
- Size of Bins: 1
- Click OK.
- Region + Segment
[Region] + "-" + [Segment]
- Segment + Region
[Segment] + "-" + [Region]
- Color
IF [@Color Dimension] = "Region" THEN [Region] ELSE [Segment] END
- Index
INDEX()
- TC_Sales
WINDOW_SUM(SUM([Sales])) / 2
- X
IF [Index] = 1 OR [Index] = 4 THEN 0 ELSE 1 END
- TC_Sales (Left)
IF [X] = 0 THEN WINDOW_SUM(SUM([Sales])) ELSE 0 END / 2
- TC_Sales (Right)
IF [X] = 1 THEN WINDOW_SUM(SUM([Sales])) ELSE 0 END / 2
- TC_Running Sales (Left)
RUNNING_SUM([TC_Sales (Left)]) - [TC_Sales (Left)]
- TC_Running Sales (Right)
RUNNING_SUM([TC_Sales (Right)]) - [TC_Sales (Right)]
- Y
IF [X] = 0 THEN IF [Index] = 1 THEN [TC_Running Sales (Left)] ELSEIF [Index] = 4 THEN [TC_Running Sales (Left)] + [TC_Sales (Left)] END ELSE IF [Index] = 2 THEN [TC_Running Sales (Right)] ELSEIF [Index] = 3 THEN [TC_Running Sales (Right)] + [TC_Sales (Right)] END END
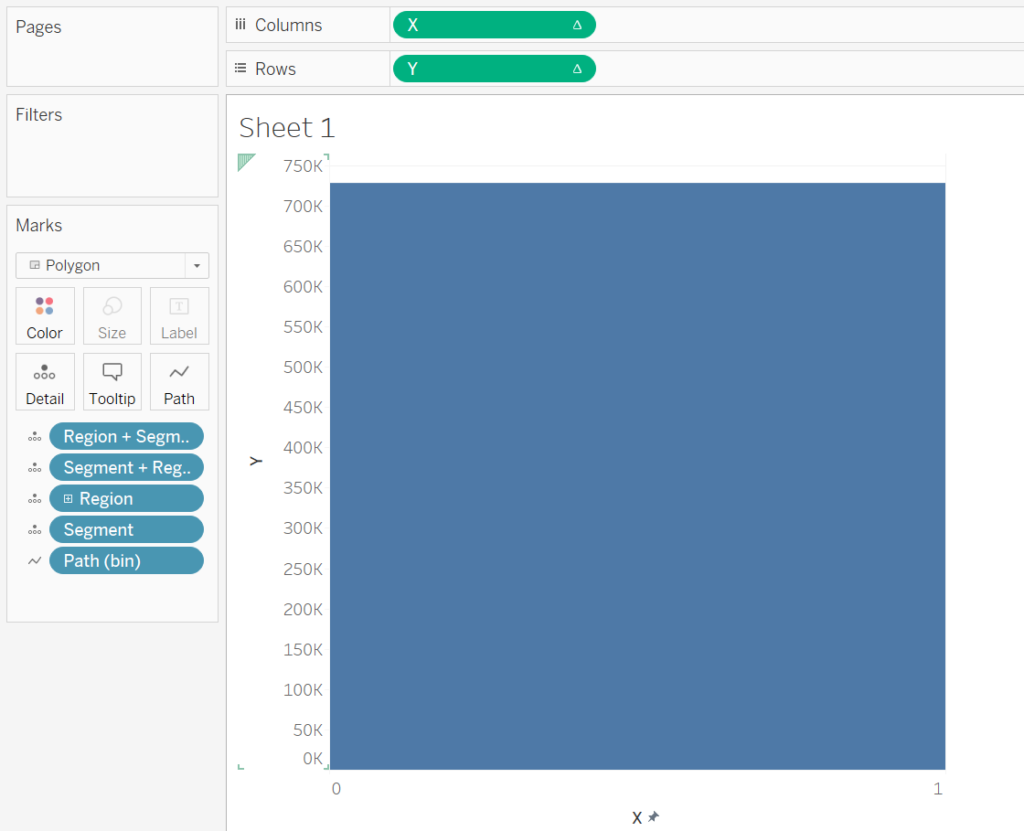
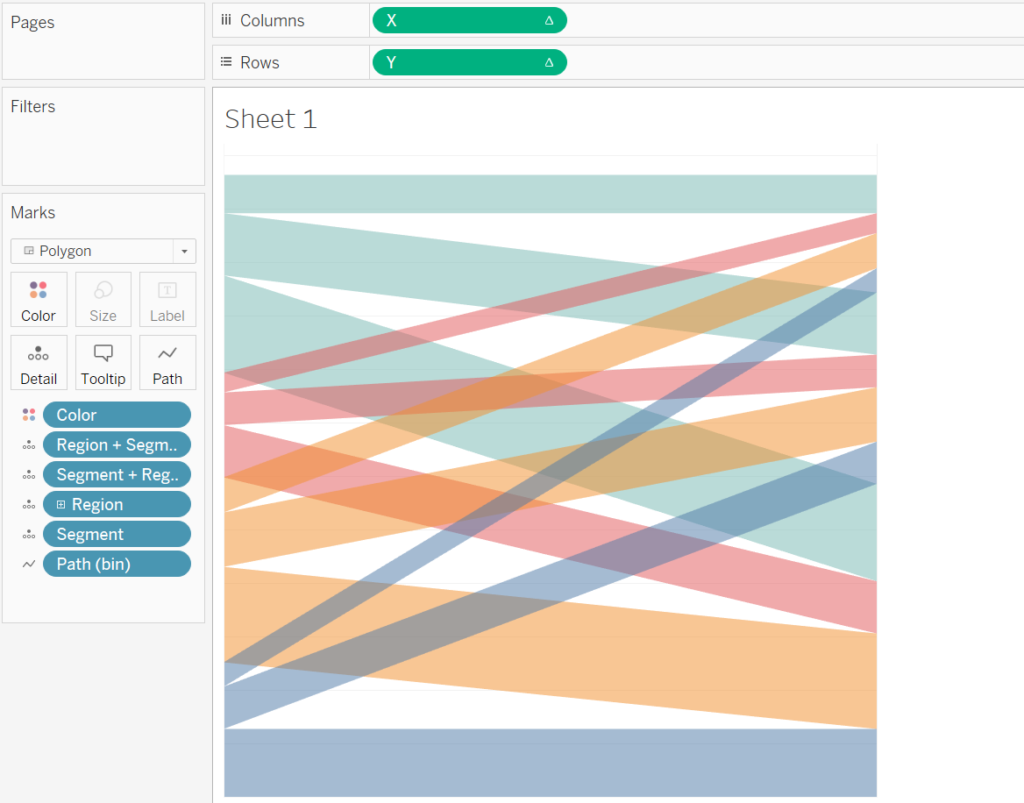
Step 3: Build the Parallel Set Worksheet
- Set Mark Type
- Change the Mark Type to Polygon.
- Drag Fields to Shelves
- Drag Path (bin) to the Columns shelf.
- Right-click the pill and ensure Show Missing Values is selected.
- Drag the same pill to the Path mark.
- Drag Region + Segment and Segment + Region to the Detail mark.
- Drag Region and Segment to the Detail mark.
- Drag X to the Columns shelf.
- Right-click the pill, go to Compute Using, and select Path (bin).
- Drag Y to the Rows shelf.
- Right-click the pill, go to Compute Using, and select Path (bin).
- Drag Path (bin) to the Columns shelf.
- Adjust the X-Axis Range
- Double-click the X-Axis Header and fix the range to
0 to 1.
- Double-click the X-Axis Header and fix the range to
Step 4: Adjust Table Calculations
- Drag Color to Color Mark
- Edit Table Calculations for Y
- Right-click the Y pill and select Edit Table Calculation.
- In Nested Calculations, select TC_Running Sales (Left):
- Compute Using: Specific Dimensions.
- Ensure the following order:
- Region
- Region + Segment
- Segment
- Segment + Region
- Path (bin)
- Color
- Set At the Level to Region + Segment.
- In Nested Calculations, select TC_Running Sales (Right):
- Compute Using: Specific Dimensions.
- Ensure the following order:
- Segment
- Segment + Region
- Region
- Region + Segment
- Path (bin)
- Color
- Set At the Level to Segment + Region.
Step 5: Final Adjustments
- Hide Axes
- Right-click the X and Y axis headers and select Hide.
- Remove Gridlines and Dividers
- Go to Format > Lines and hide gridlines, zero lines, row dividers, and column dividers.
- Set Transparency
- Adjust the polygon opacity to 50% for a sleek look.
Step 6: Additional Worksheets
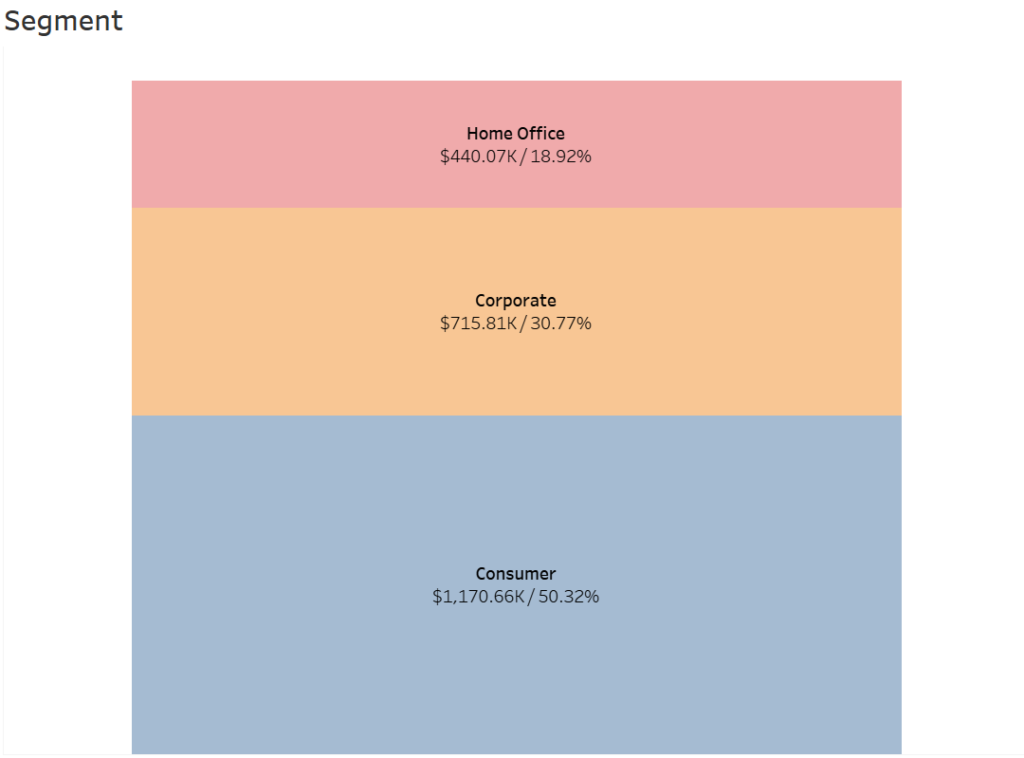
Segment Worksheet
- Create a new worksheet called Segment.
- Drag Sales onto the Rows shelf.
- Drag Segment to the Color and Label marks.
- Divide Sales by
2and format. - Add a Quick Table Calculation to display Percentage of Total.
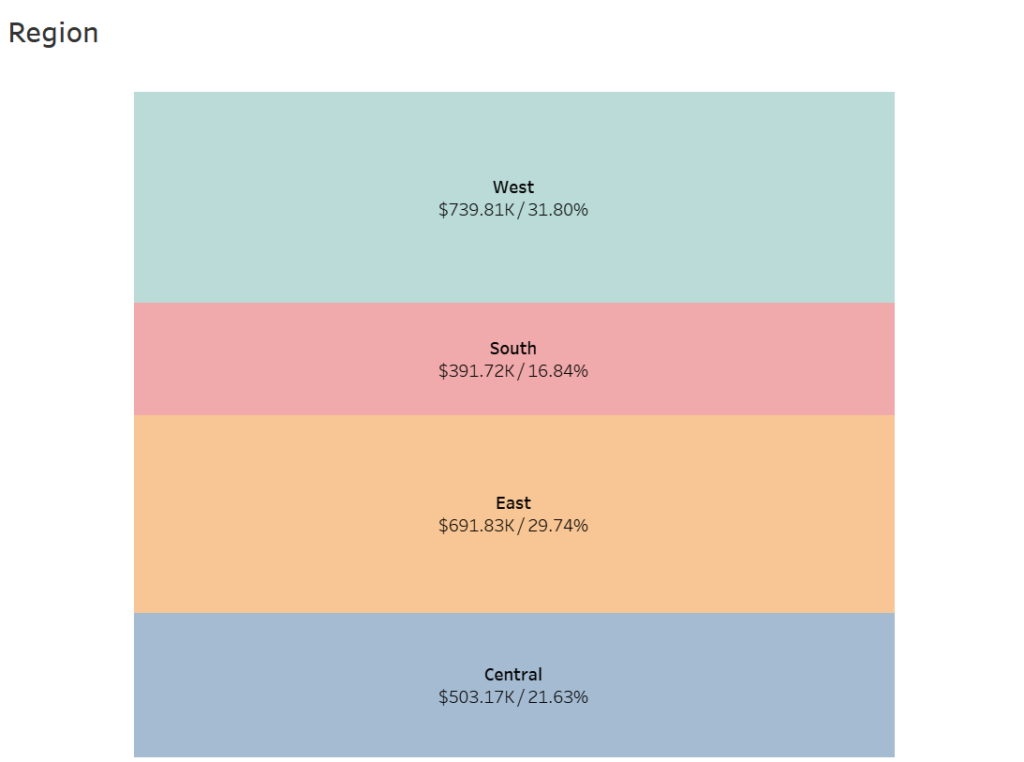
Region Worksheet
- Create a new worksheet called Region.
- Repeat the same steps as the Segment Worksheet, using Region instead of Segment.
Step 7: Combine into a Dashboard
- Create a new dashboard.
- Add the Parallel Set, Segment, and Region worksheets to the layout.
- Format the dashboard to perfection.

Parallel sets are a powerful way to visualize relationships and flows between categories. By combining calculated fields, table calculations, and formatting techniques, you can create an interactive and visually stunning chart in Tableau. While these visualizations can be complex to build, their impact makes the effort worthwhile.
Check it out on Tableau Public