
Table calculations in Tableau are powerful tools that allow you to perform computations directly on the aggregated results in your visualization. Unlike calculated fields (which operate at the data source level), table calculations depend on the structure of your table or pane, making them ideal for dynamic, context-aware metrics. In this guide, we’ll break down compute using options, advanced settings like addressing and partitioning, and demonstrate practical examples using Tableau’s Superstore dataset.
What Are Table Calculations?
Table calculations are applied to the results of your query after aggregation. They enable you to compute metrics like running totals, percent of total, moving averages, and rank comparisons directly within your visualization. Their behavior depends on two key factors:
- Compute Using: The direction of calculation (e.g., across, down, pane, or cell).
- Partitioning vs. Addressing: Whether the calculation restarts (partitioning) or spans the entire view (addressing).
Compute Using Options: Explained with Superstore Examples
Let’s explore the five primary compute using options using Tableau’s Superstore dataset.
1. Table (Across)
- What it does: Computes values from left to right across the table.
- Example: Month-over-Month Sales Growth
- Steps:
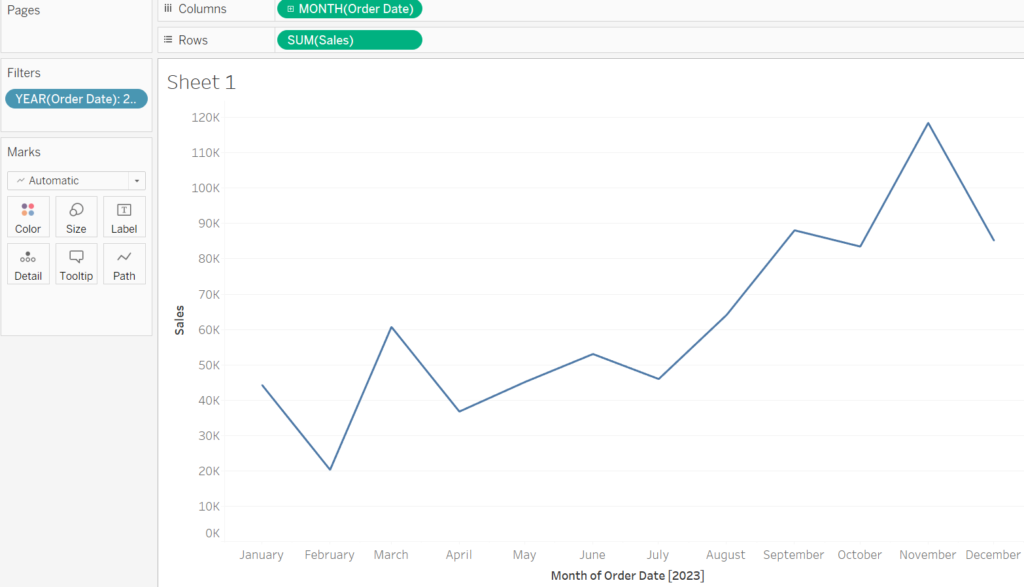
- Drag
Order Date(Month) to Columns andSalesto Rows. - Create a line chart.
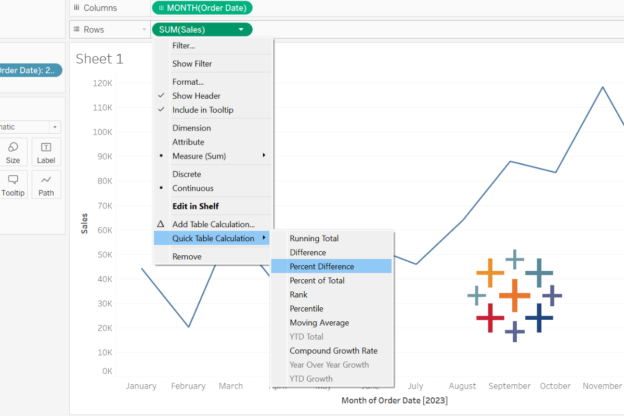
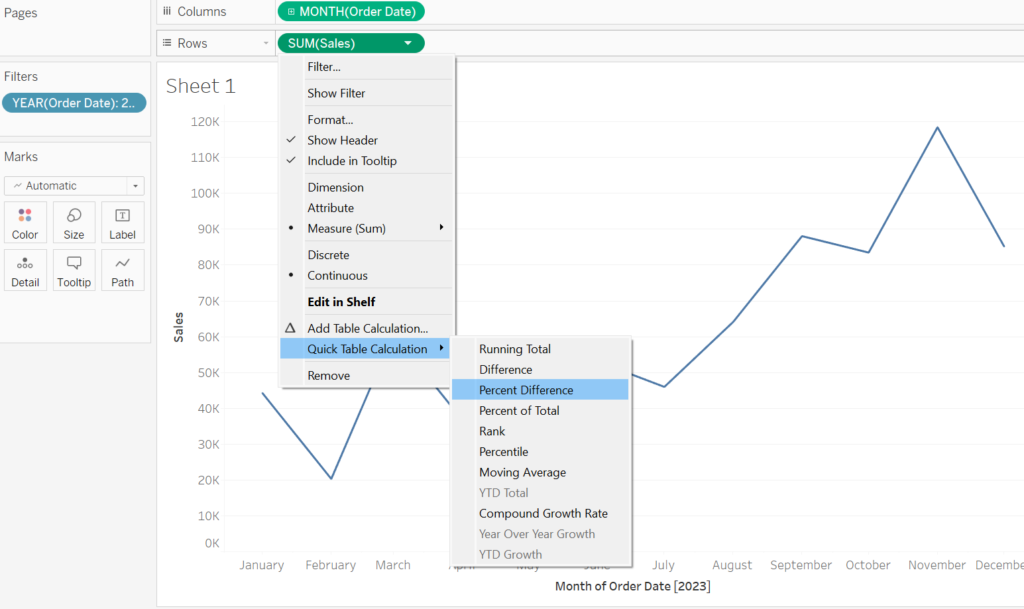
- Right-click
Sales> Quick Table Calculation > Percent Difference From. - Set Compute Using to
Table (Across).
- Drag
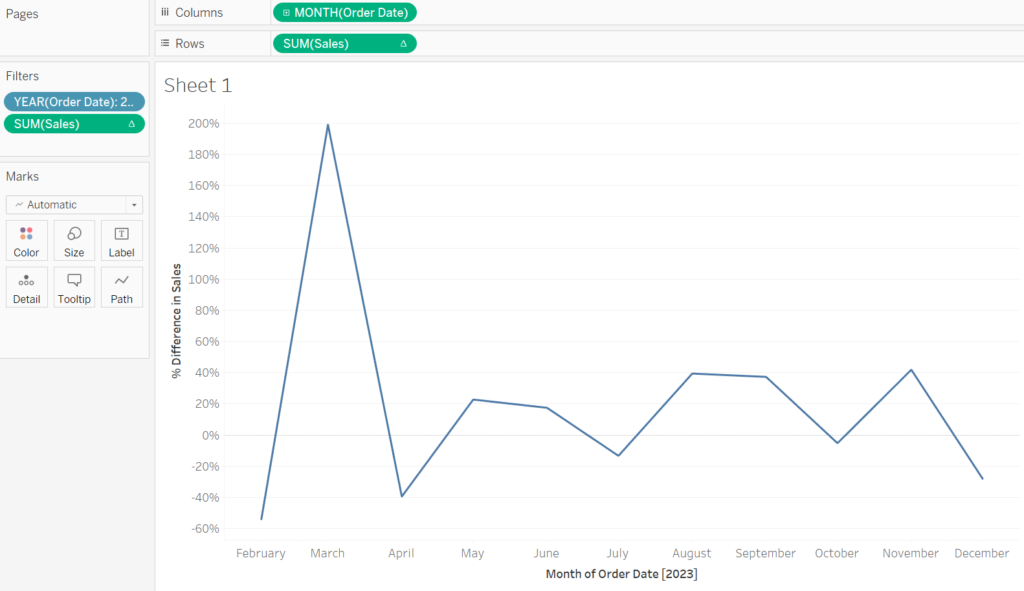
- Result: The % difference compares each month’s sales to the previous month.
- Steps:

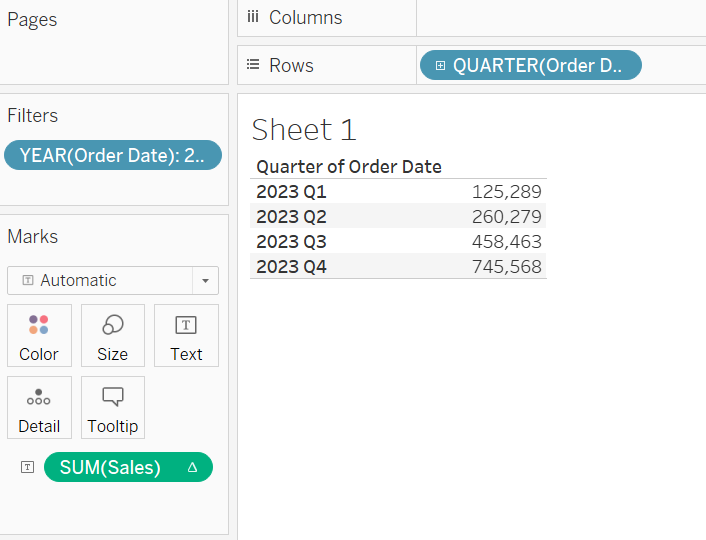
2. Table (Down)
- What it does: Computes values from top to bottom.
- Example: Running Total of Sales by Quarter
- Steps:
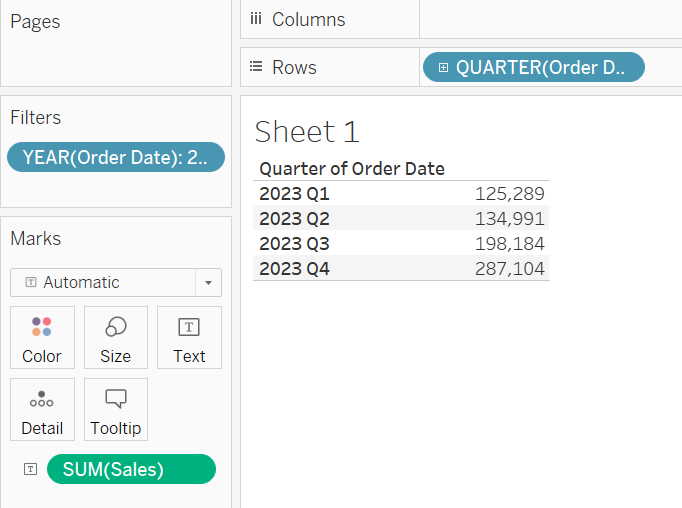
- Drag
Order Date(Quarter) to Rows andSalesto Text. - Right-click
Sales> Quick Table Calculation > Running Total. - Set Compute Using to
Table (Down).
- Drag
- Result: Cumulative sales increase down the rows, e.g., Q1: 100K,Q2:100K,Q2:250K, Q3: $400K.
- Steps:
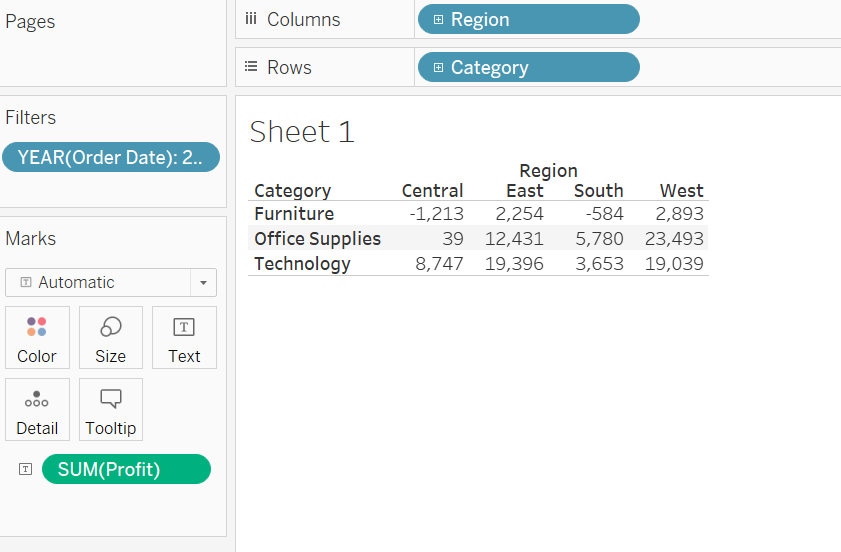
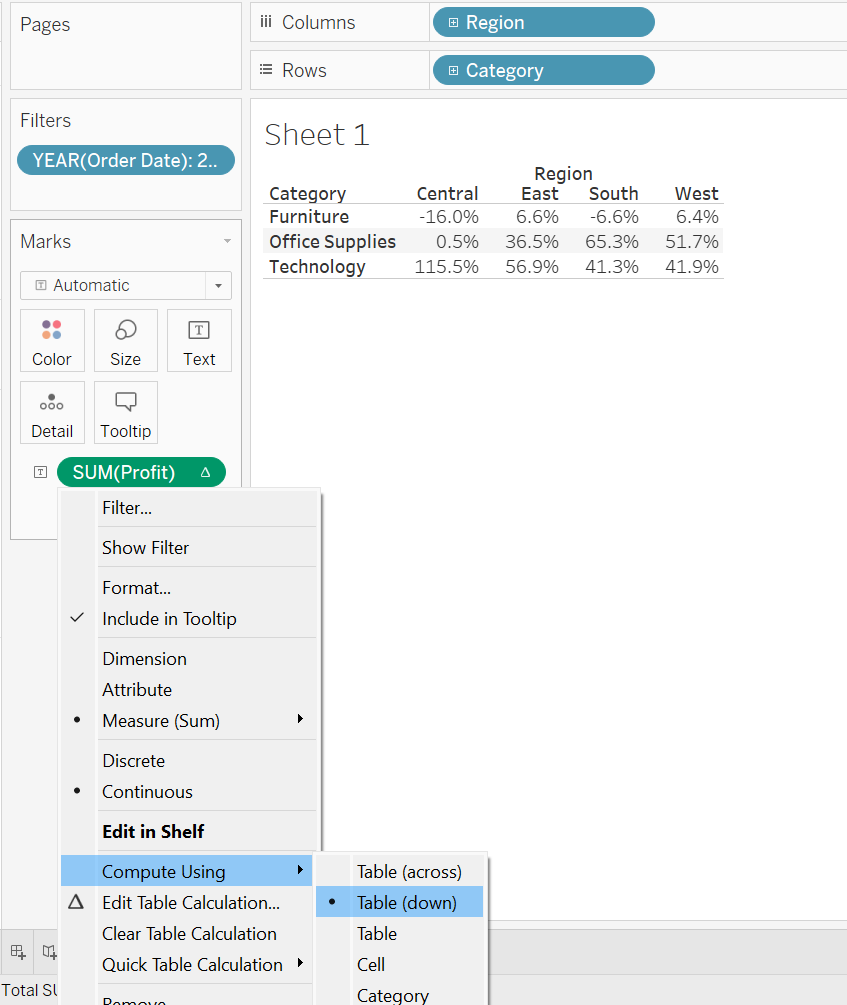
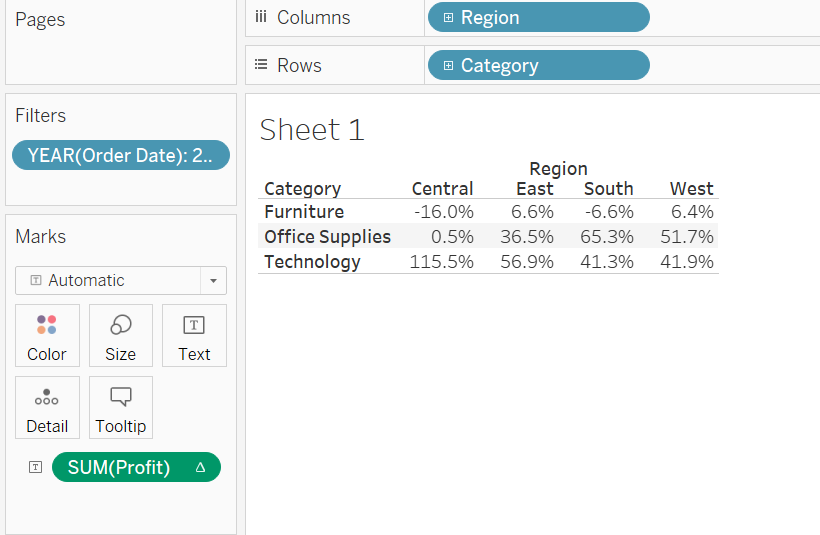
3. Pane (Down then Across)
- What it does: Computes within each pane or sub-section of the view.
- Example: Profit Percent of Total by Category
- Steps:
- Drag
Categoryto Rows andProfitto Text. - Add
Regionto Columns to split the view into panes. - Apply Percent of Total to
Profitand set Compute Using toPane (Down).
- Drag
- Result: Each pane shows the profit % contribution of Furniture, Technology, and Office Supplies within its region.
- Steps:
4. Specific Dimensions
- What it does: Customize partitioning and addressing by selecting dimensions.
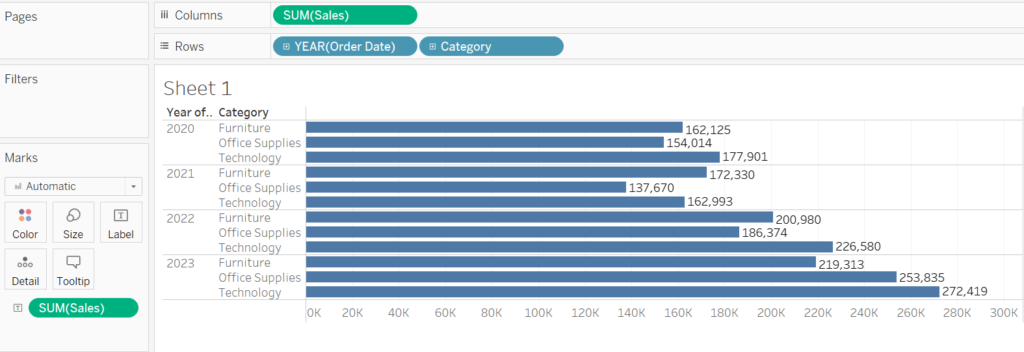
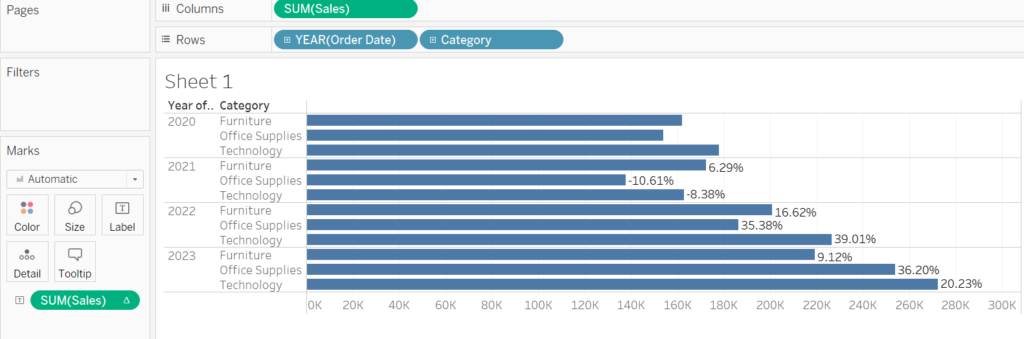
- Example: Year-over-Year Sales Growth by Category
- Steps:
- Drag
Order Date(Year) andCategoryto Rows,Salesto Columns. - Apply Percent Difference From and set Compute Using to
Specific Dimensions. - Partition by
Category(uncheck) and address byYear(check).
- Drag
- Result: Each category’s sales growth is calculated independently across years. (First year will have empty value as it’s the starting year)
- Steps:
Advanced Options: Addressing vs. Partitioning
- Addressing: The direction the calculation moves (e.g., across columns or down rows).
- Partitioning: The scope where the calculation restarts (e.g., by region or category).
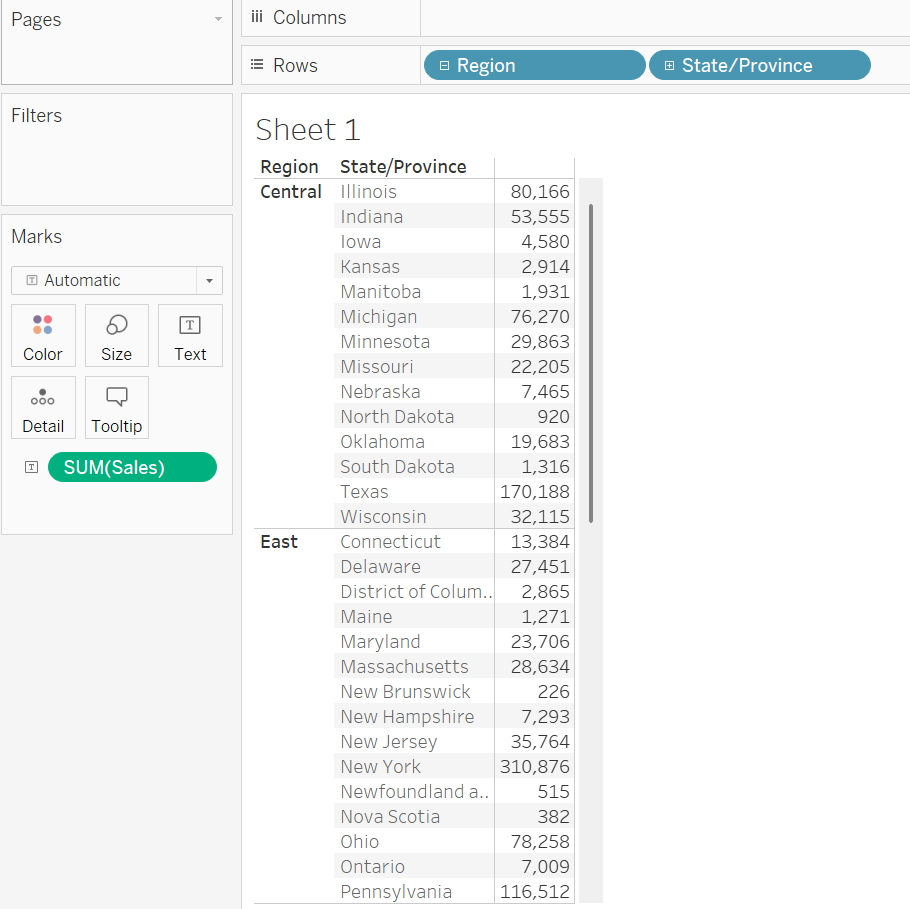
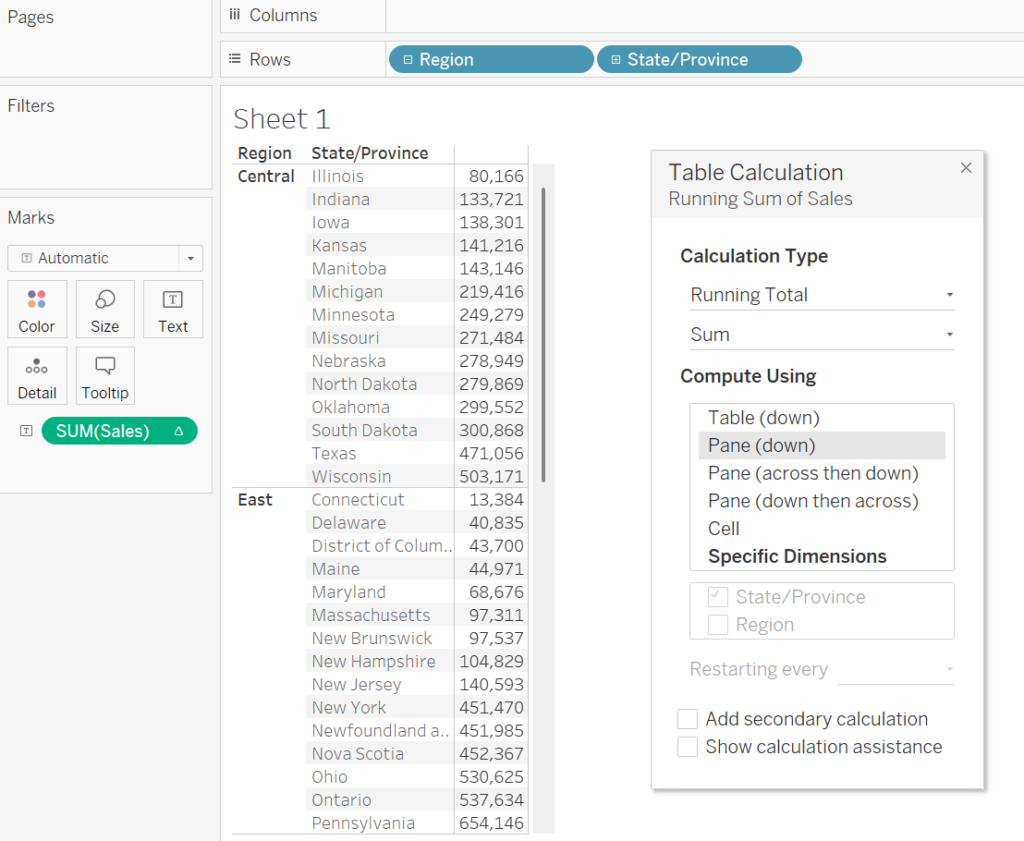
Example: Running Total by State, Partitioned by Region
- Drag
RegionandStateto Rows,Salesto Text. - Apply Running Total and partition by
Region(calculation restarts for each region).
Relative vs. Absolute Settings
- Relative: Computations are offset from the current cell (e.g., “previous 3 months”).
- Absolute: Fixed references (e.g., “compare to January 2023”).
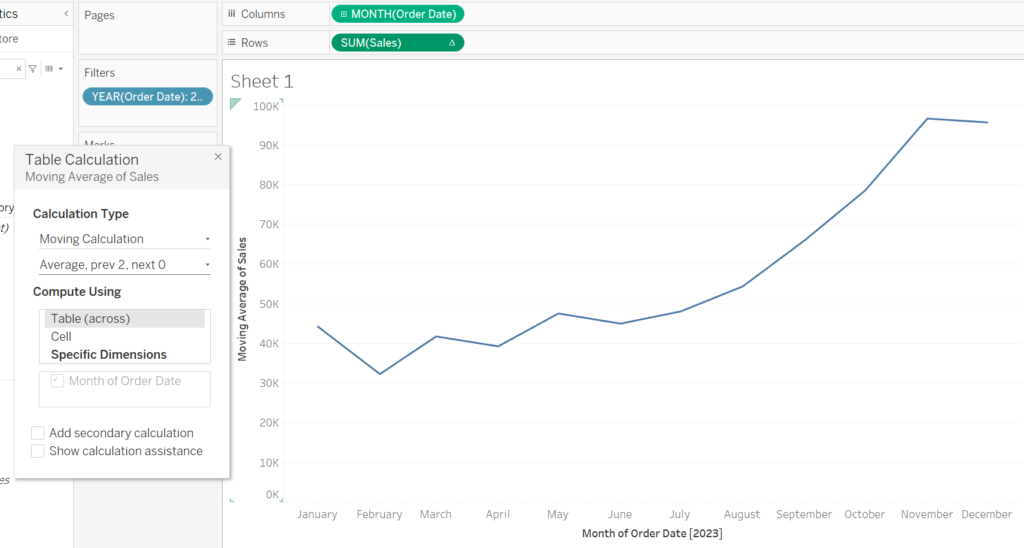
Example: 3-Month Moving Average (Relative)
- Use
Order Date(Month) andSales. - Apply a Moving Average with a 3-month window.
Pro Tips for Effective Table Calculations
- Right-Click to Edit: Adjust settings via the calculation’s context menu.
- Visualize the Flow: Use arrows in the table calculation editor to preview direction.
- Combine with LODs: Pair with Level of Detail expressions for granular control.
Conclusion
Table calculations unlock advanced analytics directly in Tableau’s visual layer. By mastering compute using options and partitioning/addressing logic, you can create dynamic metrics like running totals, growth rates, and rankings—all without complex SQL. Use the Superstore examples above to experiment, and soon you’ll be leveraging table calculations like a pro!