
In Power BI, effectively ranking data is crucial for insightful analysis. Two primary DAX functions facilitate this: TOPN and RANKX. While both serve to rank data, they operate differently and are suited for distinct scenarios.
Understanding RANKX vs. TOPN in Power BI
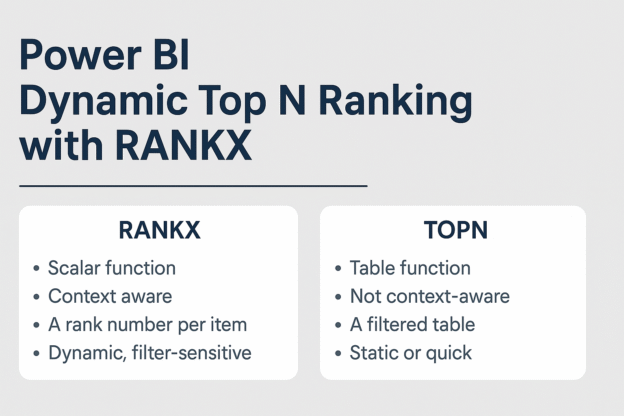
Before diving into the how-to, it’s important to understand the core difference between RANKX and TOPN.
| Feature | RANKX | TOPN |
|---|---|---|
| Type | Scalar function – returns a rank per row | Table function – returns a filtered table |
| Context Aware | Yes – respects row context, slicers, and filters | No – must be wrapped in CALCULATE to be dynamic |
| Output | A rank number per item | A filtered list of top N rows |
| Use Case | Dynamic, filter-sensitive ranking for reports | Static or quick top N table creation |
| Typical Scenario | Visual ranking with slicers (Top 10 customers by region) | Show top N products in a measure or KPI |
Step-by-Step: Building Dynamic Top N Ranking with RANKX
Step 1: Create a Sales Measure
Total Sales = SUM('Orders'[Sales])Step 2: Create a What-If Parameter for N
Go to Modeling > New Parameter:
- Name:
TopNSelector - Data Type: Whole Number
- Min: 1, Max: 20, Increment: 1
- Default: 5
This creates a slicer that lets users control the N in “Top N.”
Step 3: Create a Dynamic Rank Measure
Create the RANKX Measure
Customer Rank =
RANKX(
    ALL('Customers'[Customer Name]),        -- Ranks all customers, ignoring filters
    CALCULATE([Total Sales]),               -- Evaluate Total Sales for each
    ,
    DESC,
    Dense
)
Use
CALCULATEto ensure proper evaluation withinRANKX.
WithoutALL(...), each row may see itself only—causing all ranks to return 1.
Optional: Respect Filters with ALLSELECTED
If you’d like the ranking to adjust based on filters (like Region):
Customer Rank =
RANKX(
    ALLSELECTED('Customers'[Customer Name]),
    CALCULATE([Total Sales]),
    ,
    DESC,
    Dense
)
Step 4: Create a Flag to Filter Top N
Top N Customer Flag =
IF(
    [Customer Rank] <= SELECTEDVALUE('TopNSelector'[TopNSelector]),
    1,
    0
)
Use this flag to control which rows appear in your visual.
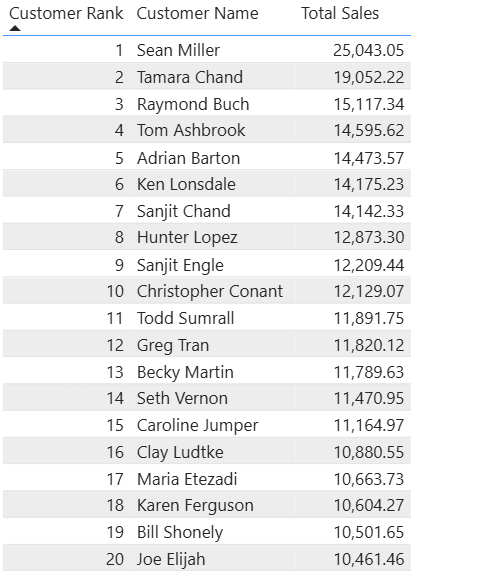
Step 5: Build the Table Visual
In a table visual, add:
Customer Name[Total Sales][Customer Rank]
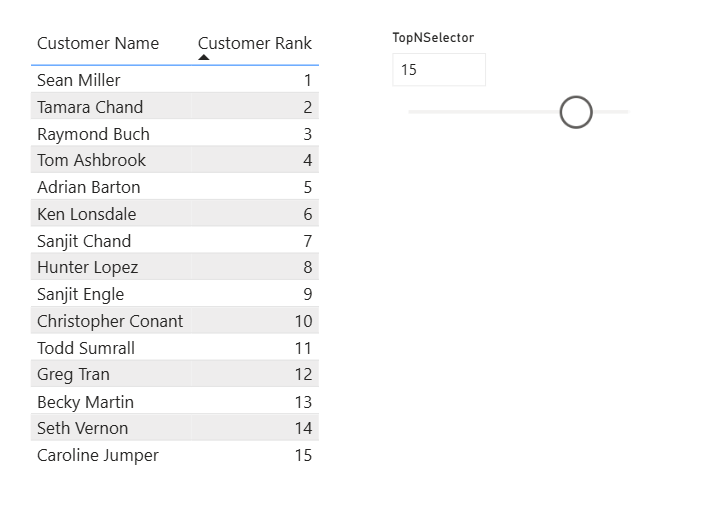
Apply a visual-level filter:
- Filter on
Top N Customer Flag= 1
Place the TopNSelector slicer on the page to let users pick their desired Top N.
When to Use TOPN vs. RANKX
- Use
TOPN: For simple, static rankings where filter context isn’t a concern. It’s quick and easy for straightforward top N. - Use
RANKX: When you need dynamic rankings that adjust based on user interactions, slicers, or filters. It provides more flexibility and accuracy in interactive reports.
Additional Tips
- Handling Ties: The
Denseparameter inRANKXensures that tied values receive the same rank, and the next rank is the subsequent integer. - Filter Context: Be cautious with filter contexts. Using
ALLremoves filters from the specified table, whileALLEXCEPTretains filters on specified columns. - Performance: For large datasets, be mindful of performance implications when using these functions, especially within complex measures or visuals.
By understanding and appropriately applying TOPN and RANKX, you can create dynamic, responsive reports in Power BI that provide valuable insights tailored to user interactions.
Discover more from Daily BI Talks
Subscribe to get the latest posts sent to your email.