Geographic data is often stored in a Degree-Minute-Second (DMS) format, making it a bit tricky to convert into the standard decimal degrees (DD) required for Tableau’s mapping functions. In this post, I’ll walk you through how to transform DMS coordinates to decimal degrees directly in Tableau, step-by-step, so you can plot your geographic data without headaches.
Why DMS to Decimal Degrees?
Geographers love the DMS format because it offers precision with degrees, minutes, and seconds (e.g., 37° 46' 30" N, 122° 25' 10" W). However, Tableau can only plot coordinates using the decimal degrees (e.g., 37.775°, -122.4194°). This transformation allows Tableau to interpret your data correctly for mapping purposes.
The DMS Format Explained
Let’s break down a DMS coordinate:
Example: 37° 46′ 30″ N
- Degrees (°): 37
- Minutes (‘): 46
- Seconds (“): 30
- Direction: North (N)
To convert this to decimal degrees:Decimal Degrees=Degrees+Minutes60+Seconds3600\text{Decimal Degrees} = \text{Degrees} + \frac{\text{Minutes}}{60} + \frac{\text{Seconds}}{3600}Decimal Degrees=Degrees+60Minutes+3600Seconds
If the coordinate is South (S) or West (W), the final value is negative.
Steps to Convert DMS to Decimal Degrees in Tableau
Step 1: Prepare and Review Your Data
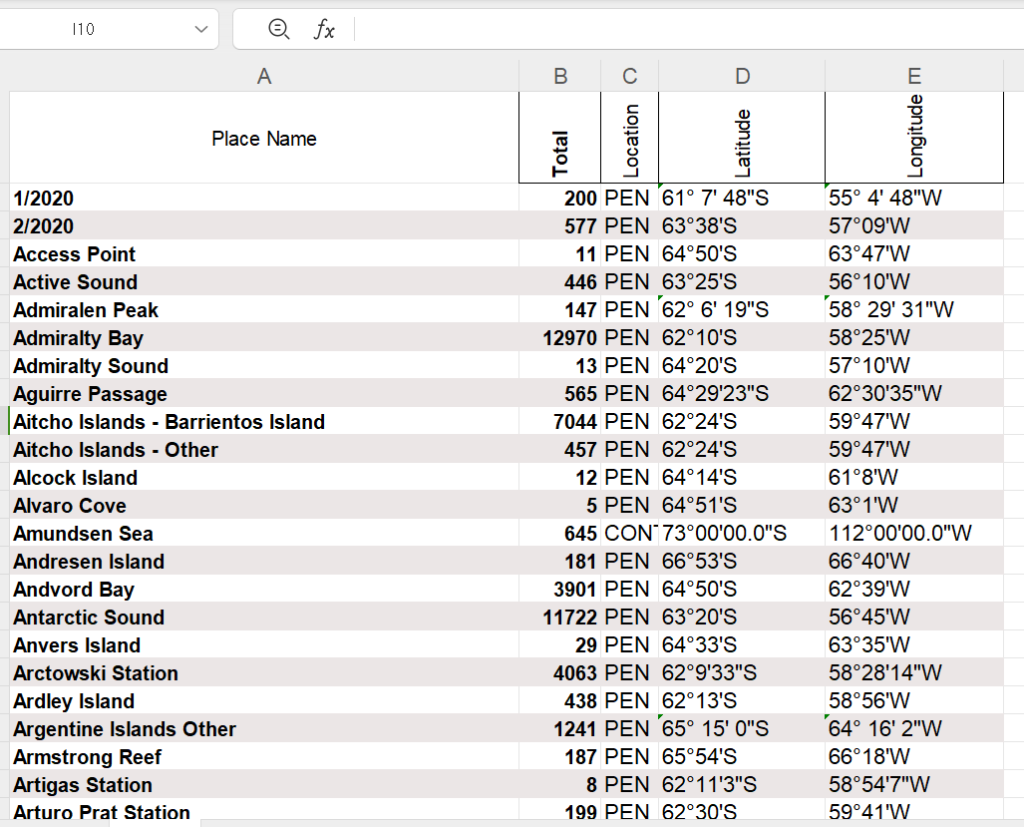
Ensure your data source includes DMS values in a consistent format. In the most ideal situation, the data should contain all 4 elements degree, minute, second and direction like this:
- Latitude:
37° 46' 30" N - Longitude:
122° 25' 10" W
However, real-world data is rarely perfect. Some coordinates in the dataset may lack the seconds element, so we need to handle both scenarios smoothly. For this post, I’m working with a dataset of landing spots in Antarctica. Here’s a sample of the data, where you can clearly see that some entries include the seconds element, while others do not.

Step 2: Create Calculated Fields
To convert the coordinates into decimal degrees, we need to separate the degrees, minutes, and (if present) seconds.
If you’re not too familiar with the SPLIT function, no problem! We’ll begin by using Tableau’s built-in custom split feature to help extract these components and build the formula step-by-step.


To extract the degree part, which is the portion to the left of the “°” symbol, the formula looks like this:
SPLIT( [Latitude], "°", 1 )To get the right part of “°”, we only need to change 1 to -1.
SPLIT( [Latitude], "°", -1 )Building on that, we next split the coordinate using the minute (‘) symbol and extract the part to the left as the minutes.
SPLIT( SPLIT( [Latitude], "°", -1 ) ), "'", 1 ) Now that we have the Degree and Minute components, the tricky part is handling the Seconds. Some fields include the seconds value, while others do not. If a field is missing the seconds, we’ll assume it as 0.
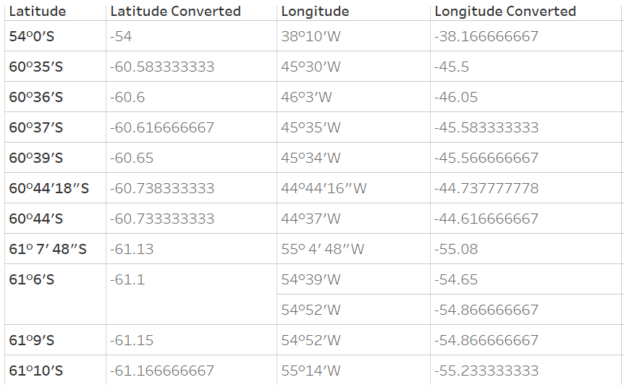
With that in mind, here is the final calculated field to convert Degree, Minute, Second, and Direction into Latitude or Longitude.
Latitude (Decimal) Calculation
// Latitude (Decimal Degrees)
IF CONTAINS([Latitude], 'S') THEN
    - (
        INT(SPLIT([Latitude], '°', 1)) +
        INT(SPLIT(SPLIT([Latitude], '°', -1), "'", 1)) / 60 +
        IFNULL(
            FLOAT( SPLIT( SPLIT( [Latitude], "'", -1 ) , """", 1 ) )/3600,0)
    )
ELSE
    INT(SPLIT([Latitude], '°', 1)) +
    INT(SPLIT(SPLIT([Latitude], '°', -1), "'", 1)) / 60 +
    IFNULL(
            FLOAT( SPLIT( SPLIT( [Latitude], "'", -1 ) , """", 1 ) )/3600,0)
END
Longitude (Decimal) Calculation
// Longitude (Decimal Degrees)
IF CONTAINS([Longitude], 'W') THEN
    - (
        INT(SPLIT([Longitude], '°', 1)) +
        INT(SPLIT(SPLIT([Longitude], '°', -1), "'", 1)) / 60 +
        IFNULL(
            FLOAT( SPLIT( SPLIT( [Longitude], "'", -1 ) , """", 1 ) )/3600,0)
    )
ELSE
    INT(SPLIT([Longitude], '°', 1)) +
    INT(SPLIT(SPLIT([Longitude], '°', -1), "'", 1)) / 60 +
    IFNULL(
            FLOAT( SPLIT( SPLIT( [Longitude], "'", -1 ) , """", 1 ) )/3600,0)
END
Step 3: Validate Visualize the Data in Tableau
- Drag and drop your new calculated fields,
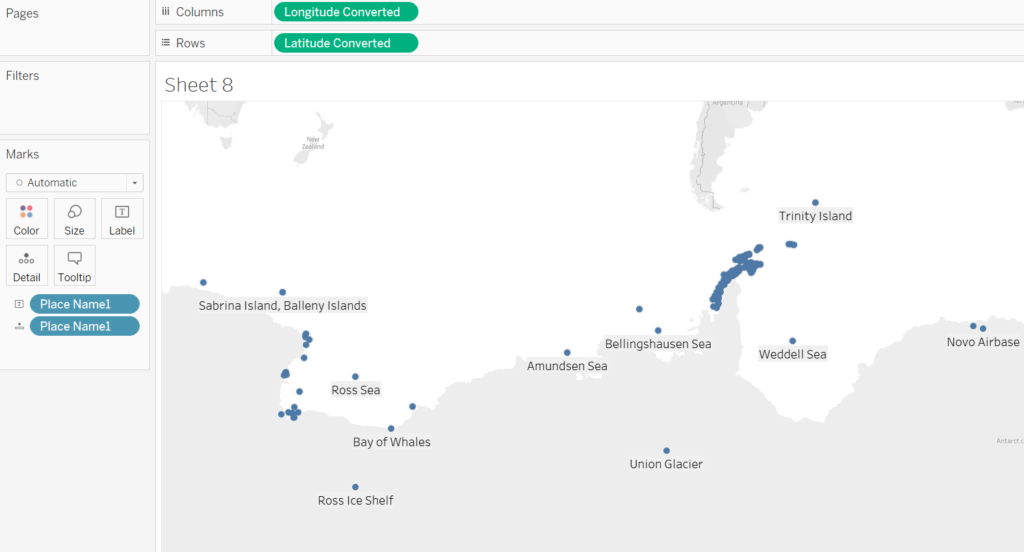
Latitude (Decimal)andLongitude (Decimal), onto the Rows and Columns shelves.(You may need to change data type first) - From the Show Me panel, select Map.
- Tableau will now plot your coordinates accurately.

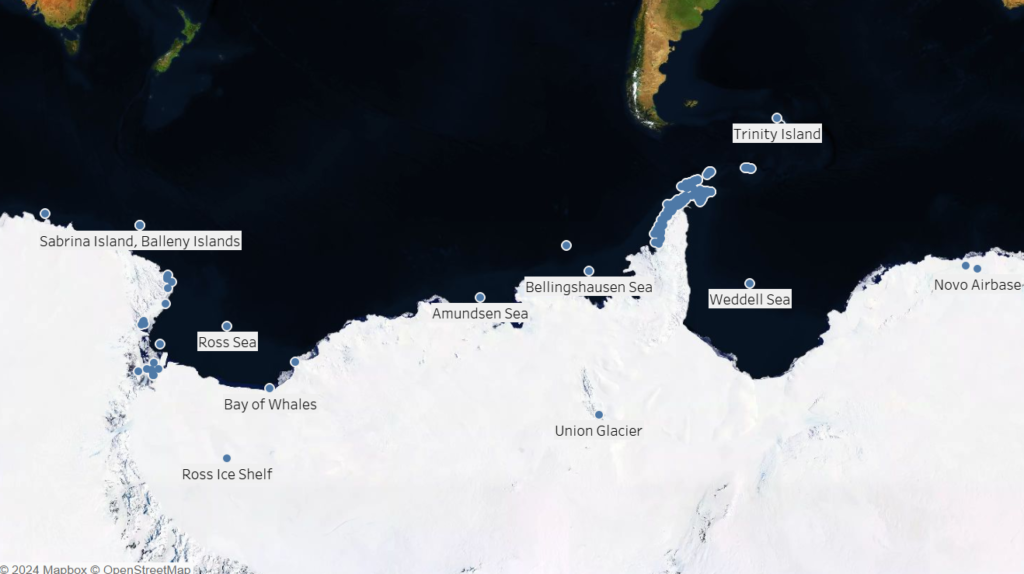
And there you have it! The popular landing spots in Antarctica are now displayed on the map. To make it even more realistic, you can switch the map background to a satellite view.

Converting DMS to decimal degrees may seem complex, but with calculated fields in Tableau, it’s straightforward and ensures your maps display correctly. Whether you’re mapping store locations, delivery zones, or customer coordinates, following this process ensures that your geographic insights are precise and visually clear.
Discover more from Daily BI Talks
Subscribe to get the latest posts sent to your email.

