Category Archives: Tableau

Bar in bar dailybitalks.com

How to Build a Grouped Bar Chart in Tableau (The Smarter Alternative to Stacked Bars)

Stacked bar charts are often used to display the breakdown of data within categories, but they have a big drawback: once you go beyond the first layer, comparing the rest becomes visually difficult. That’s where grouped bar charts step in.

In this guide, we’ll walk through a smart workaround for creating grouped bars in Tableau—based on a clever trick originally shared by Kevin Flerlage. We’ll use the Superstore dataset to compare sales across segments within regions, laid out cleanly and clearly.


Step 1: Set Up the Base View

  1. Open Tableau and connect to the Sample – Superstore dataset.
  2. Drag Region to the Columns shelf.
  3. Drag Sales to the Rows shelf.
  4. Set Mark Type to Bar.
  5. You now have a basic bar chart showing sales by region.

Step 2: Duplicate the Dimension to Force a Group

Now we want to break each Region into groups for each Segment (Consumer, Corporate, Home Office). But instead of stacking, we want those bars side by side.

Here’s the trick:

  1. Drag Segment to the Columns shelf, and drop it to the right of Region.
    • The structure should now be: RegionSegment on Columns.
  2. This effectively creates mini-clusters within each Region—exactly what we want.
  3. Now drag Sales to Rows again (or reuse the one already there). It should now create individual bars for each Segment per Region.

Step 3: Synchronize Color & Labeling

  1. Drag Segment to Color on the Marks card to give each bar a distinct hue.
  2. Drag Sales to Label on the Marks card to show values directly on each bar.
  3. Adjust label alignment if needed—top of bar is often best for readability.

Step 4: Add a Total Reference Bar

Now here’s the genius part. We want to include the total sales for each Region behind the grouped bars, using a faint background bar to show the full total. This gives us both segment detail and region-level context.

Steps:

  1. Duplicate the Sales field in the data pane (right-click → Duplicate). Change it to WINDOW_SUM(SUM([Sales])) and make sure only select Segment as dimension.
  2. Right-click on the second axis (Total Sales) and choose Dual Axis.
  3. Right-click the secondary axis again and choose Synchronize Axis.
  4. On the Marks card, you’ll now have two layers:
    • One for Sales by Segment
    • One for Total Sales by Region

Customize the Total Bar:

  1. Click on the WINDOW_SUM layer in the Marks card.
  2. Set Mark Type to Bar.
  3. Remove Segment from the Color shelf for this layer—it should be a solid light color (e.g., gray or light blue).
  4. Bring the Segment bars to the front by adjusting the transparency or size of the total bar.
  5. (Optional) Add Region to Tooltip on the Total Sales layer to explain the background bar.

This creates a light “shadow bar” showing the full total of each region, with individual segment bars layered on top.


Step 5: Clean Up the View

Now we have a bar-in-bar chart, but there are gaps between the bars. How can we remove the blank space from the background bars? This can be achieved using the [Total] trick.

  • From Analysis -> Total ->Add All Subtotles
  • Single click on the subtotal bar, under the dropdown of automatic, click on Hide, you will see this bar disappeared without losing its place.
  • Format Total label to remove text and resize the background bar go group background bar together.
  • Remove grid lines and polishing the format, and you will have a nice-looking bar-in-bar chart!

Why This Method Works

This approach gives you the best of both worlds:

  • You maintain individual bar clarity for each Segment.
  • You also display total context with the background bar.
  • You avoid stacking confusion and make visual comparisons much easier.

Compared to standard stacked bars, grouped bars with total references are more readable, intuitive, and informative, especially when you’re working with more than two subcategories.

You can replicate this chart in any version of Tableau with the default Superstore dataset. This grouped bar method makes a great alternative to stacked bars—especially when clarity matters.

chart catalog dailybitalks.com

Tableau Chart Catalog: A Practical Guide to Building Stunning Visuals

If you’ve ever stared at a blank Tableau dashboard wondering how to move beyond bar and line charts — you’re not alone.

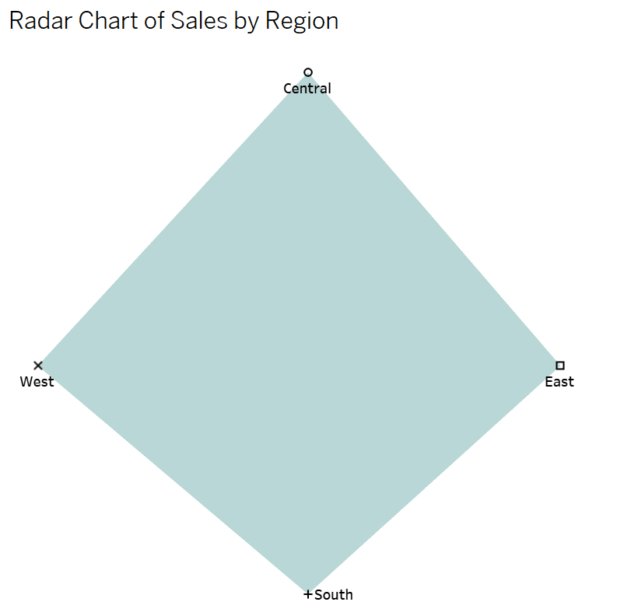
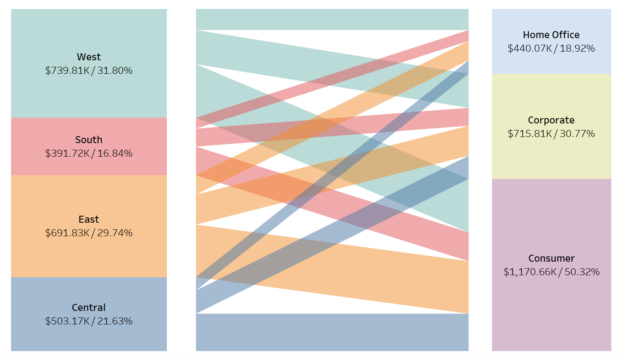
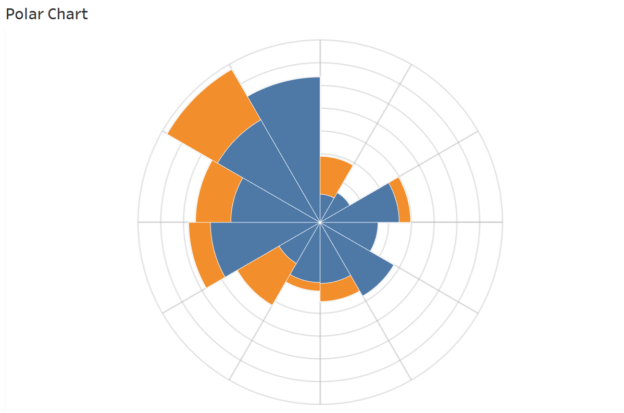
Sure, those basics serve a purpose. But data storytelling is about more than ticking boxes. It’s about helping your audience see the story behind the numbers. That’s why I started building a personal catalog of unique, visually engaging Tableau chart types — and now I’m sharing them with you.

Continue reading
chart type dailybitalks.com

Choosing the Right Chart Type: A Guide for Data Analysts

Data visualization is a powerful tool for conveying insights, but the effectiveness of a visualization largely depends on how well the chosen chart represents the underlying data. As a data analyst, selecting the appropriate chart type is critical to ensuring your message is communicated clearly and effectively. In this guide, we’ll explore the most common chart types, their strengths and weaknesses, and when to use each one.

Continue reading
tableau table calculation dailybitalks.com

Mastering Tableau Table Calculations: A Comprehensive Guide

Table calculations in Tableau are powerful tools that allow you to perform computations directly on the aggregated results in your visualization. Unlike calculated fields (which operate at the data source level), table calculations depend on the structure of your table or pane, making them ideal for dynamic, context-aware metrics. In this guide, we’ll break down compute using options, advanced settings like addressing and partitioning, and demonstrate practical examples using Tableau’s Superstore dataset.

Continue reading
How to Create Hex Polygon/Tile Grid Maps in Tableau dailybitalks.com

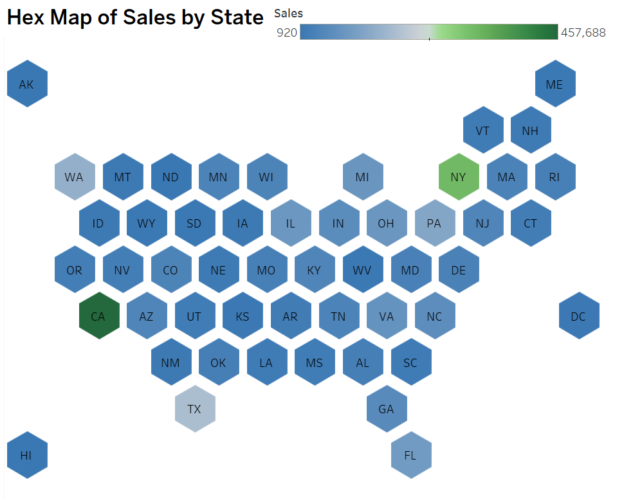
How to Create Hex Polygon/Tile Grid Maps in Tableau

Hex maps or Tile grip maps are a visually appealing alternative to traditional geographic maps. They arrange regions or states into a grid of hexagons, standardizing their size and shape while maintaining their relative positioning. This approach eliminates distortion caused by geographic size differences and focuses on comparative analysis.

Continue reading
How to Create Tilted Bar Charts in Tableau dailybitalks.com

How to Create Tilted Bar Charts in Tableau

Tilted bar charts, with their unique slanted orientation, offer a fresh perspective for visualizing comparative data. These charts can help your dashboards stand out while providing insightful visual analysis. In this tutorial, we’ll guide you through creating a tilted bar chart in Tableau using the Sample Superstore dataset.

Continue reading