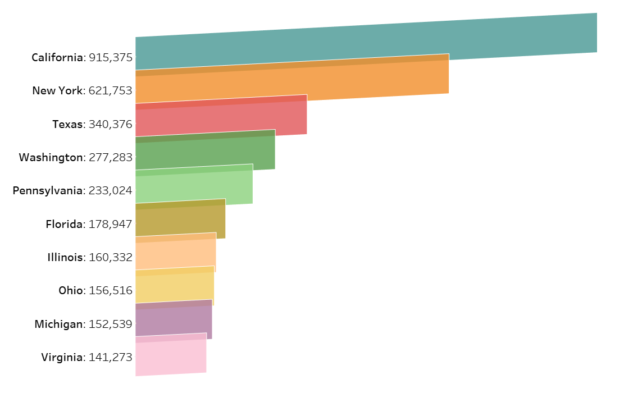
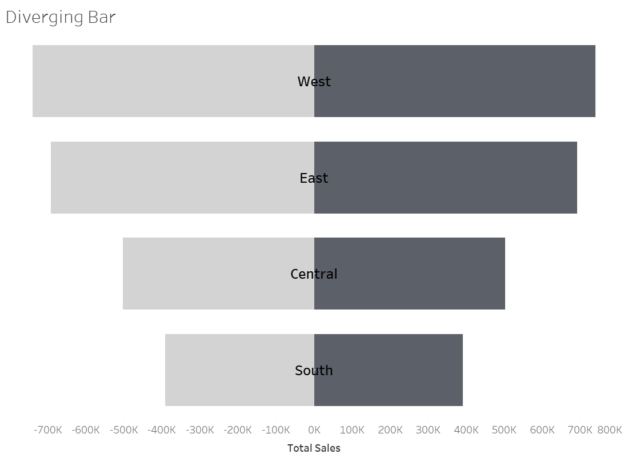
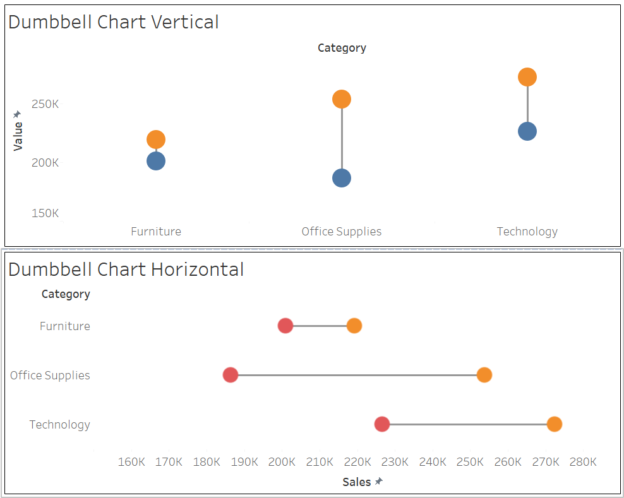
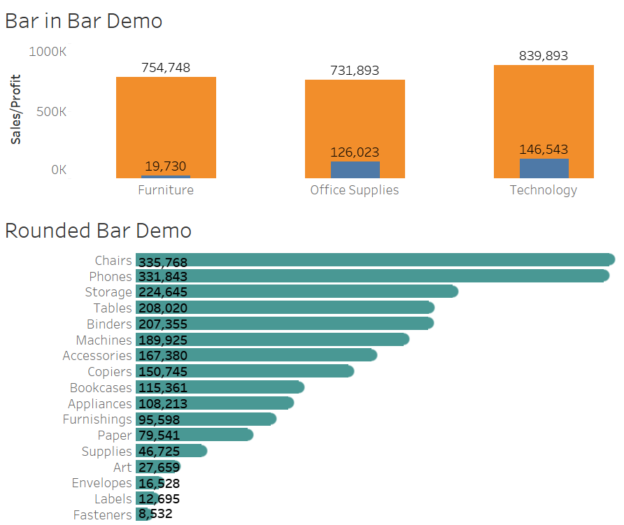
Tilted bar charts, with their unique slanted orientation, offer a fresh perspective for visualizing comparative data. These charts can help your dashboards stand out while providing insightful visual analysis. In this tutorial, we’ll guide you through creating a tilted bar chart in Tableau using the Sample Superstore dataset.
Continue reading