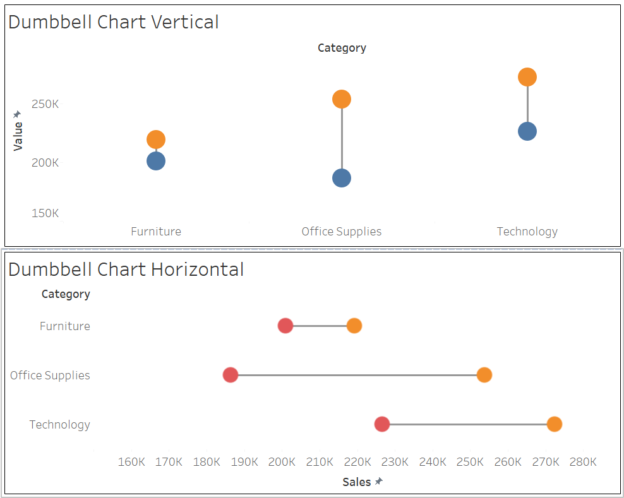
Dumbbell charts are a fantastic visualization tool for comparing two data points across categories while emphasizing the difference between them. Often used to show progress or change over time, these charts highlight how values diverge or converge for each category. In this blog post, we’ll walk you through how to create a dumbbell chart in Tableau using the Superstore dataset.
Continue reading