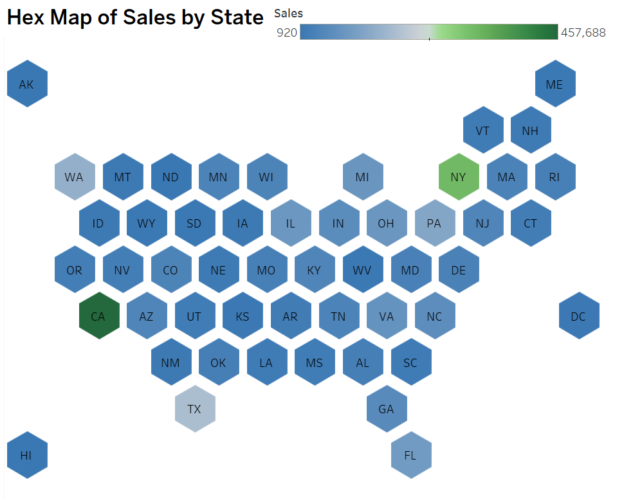
Hex maps or Tile grip maps are a visually appealing alternative to traditional geographic maps. They arrange regions or states into a grid of hexagons, standardizing their size and shape while maintaining their relative positioning. This approach eliminates distortion caused by geographic size differences and focuses on comparative analysis.
Continue reading