
A Pareto chart is a powerful visualization that combines both bar and line charts to identify the most significant factors in a dataset. Named after the Pareto principle (also known as the 80/20 rule), it helps users focus on the causes that generate the majority of results. In this article, we’ll walk through how to build a Pareto chart in Power BI using the Superstore dataset, a common sample dataset used in data visualization training.
What Is a Pareto Chart?
A Pareto chart typically:
- Shows individual values in descending order as bars (e.g., sales by category).
- Shows cumulative percentage of the total on a secondary line chart.
It is often used to identify the top contributors to a result—e.g., which few customers generate most of the sales, or which few products are responsible for most complaints.
Dataset: Superstore Sample
The Superstore dataset contains transactional data including:
- Customer Name
- Product Name
- Category and Sub-Category
- Sales, Profit, Quantity
- Region, State, City
- Order Date
You can download this dataset in Excel or CSV format from multiple sources online. In Power BI, load the dataset by choosing Home > Get Data > Excel and selecting the relevant sheet.
Step-by-Step Guide
Step 1: Load the Superstore Dataset
- Open Power BI Desktop
- Click Home > Get Data > Excel
- Choose your Superstore file and import the dataset (usually named
Orders)
Step 2: Create a Bar Chart with Customer Sales
- Insert a bar chart or clustered column chart.
- Drag Sub-Category to the X-axis.
- Drag Sales to the Y-axis.
- Sort by Sales descending.
Step 3: Create a Measure for Total Sales
Go to Modeling > New Measure, and create:
Total Sales = SUM(Orders[Sales])Step 4: Create a Measure for Cumulative Sales
Now create a cumulative sum based on the Sub-Category ranking:
Cumulative Sales =
VAR CurrentRank = RANKX(
    ALL('Orders'[Sub-Category]),
    [Total Sales],
    ,
    DESC,
    Dense
)
RETURN
CALCULATE(
    [Total Sales],
    FILTER(
        ALL('Orders'[Sub-Category]),
        RANKX(ALL('Orders'[Sub-Category]), [Total Sales], , DESC, Dense) <= CurrentRank
    )
)
Step 5: Create Cumulative Sales Percentage Measure
Now, calculate the % of cumulative vs. total:
Cumulative Sales % =
DIVIDE(
    [Cumulative Sales],
    CALCULATE([Total Sales], ALL('Orders'[Sub-Category]))
)
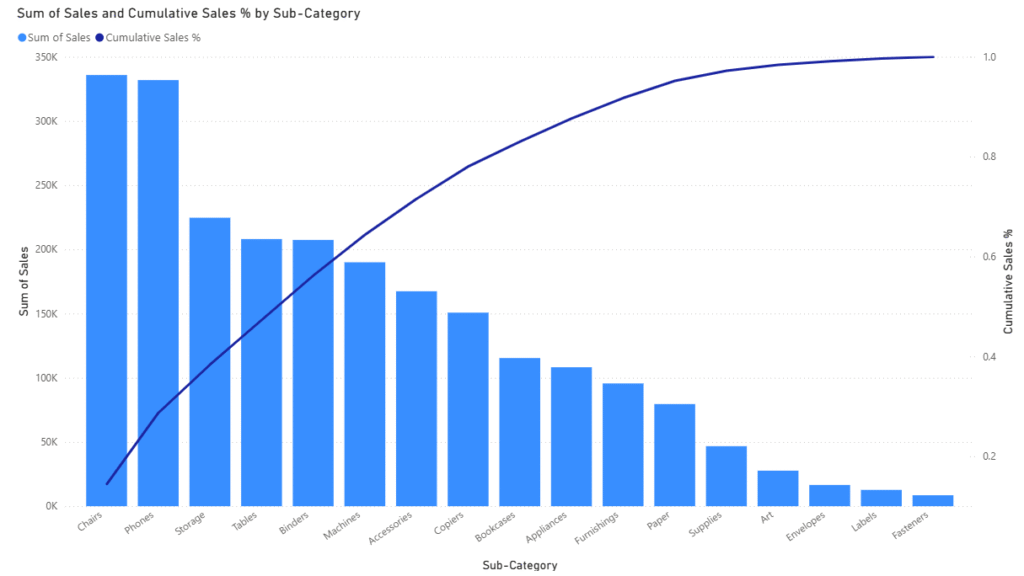
Step 6: Convert to Pareto Chart Using Dual Axis
- Change the chart to Line and Clustered Column Chart visual.
- Set up the following:
- Shared Axis:
Sub-Category - Column y-Axis Values:
Total Sales - Line y-Axis Values:
Cumulative Sales %
- Shared Axis:
- Sort by
Total Salesin descending order.
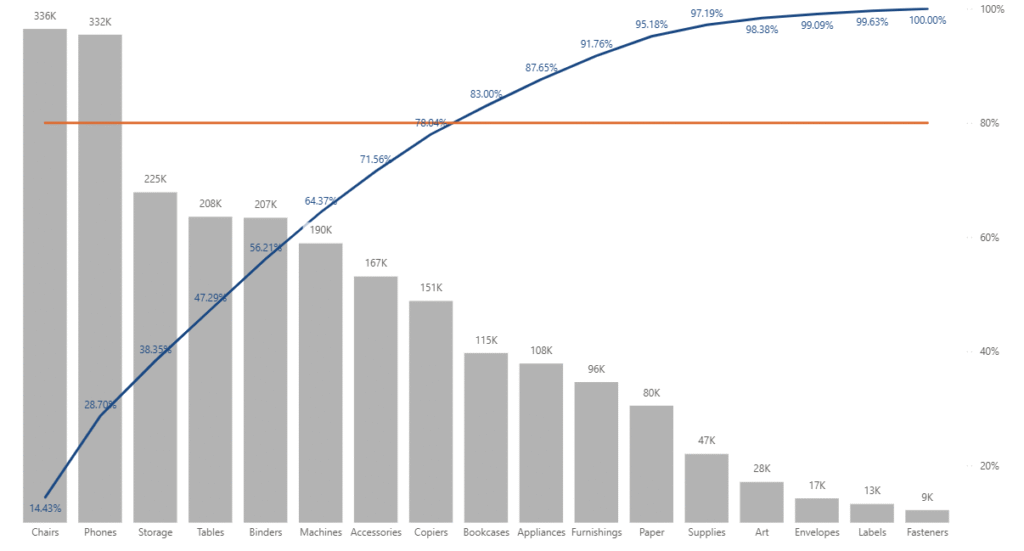
Customize Your Pareto Chart
- Format the line chart to show percentage (under
Data labels > Display units = Percentage). - Enable data labels on both bars and lines.
- Adjust color for better contrast between bars and line.
- Add a reference line at 80% to highlight Pareto threshold
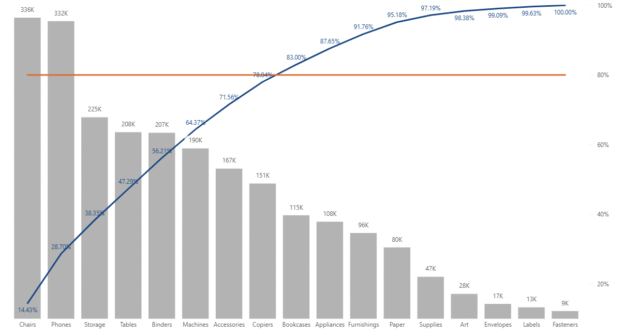
You will now see:
- Bars: Total sales by sub-category, descending
- First line: Cumulative % climbing from 0% to 100%
- Second line: Flat 80% across the chart
- You can now visually identify the sub-category at which cumulative % crosses 80%
Tips and Best Practices
| Tip | Recommendation |
|---|---|
| Use RANKX | RANKX is crucial for accurate cumulative calculations |
| Use ALLSELECTED | Keeps slicers functional when building visuals |
| Show % on Axis | Makes cumulative line easier to interpret |
| Add 80% Line | Makes the “Pareto point” visually obvious |
| Use Dual Axis | Combine line and bar cleanly with correct proportions |
Pareto charts are a great way to derive actionable insights from your data using Power BI. With just a few DAX measures and the Line and Clustered Column Chart, you can clearly visualize top contributors and make data-driven decisions.
Discover more from Daily BI Talks
Subscribe to get the latest posts sent to your email.