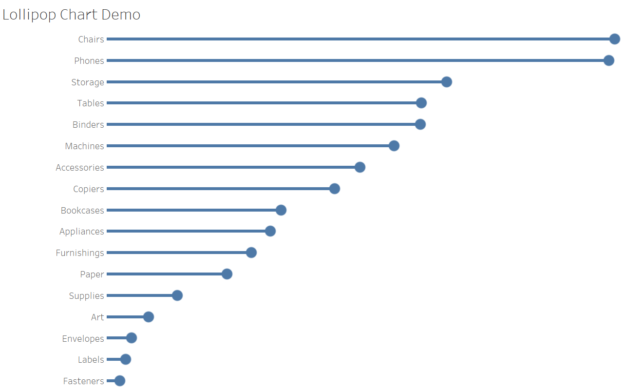
Lollipop charts are a fun and visually engaging way to display data. They combine the simplicity of a bar chart with the precision of a scatter plot, making it easy to highlight specific data points. In this tutorial, we’ll create a lollipop chart in Tableau using the Superstore dataset to showcase sales performance across categories.
Continue reading