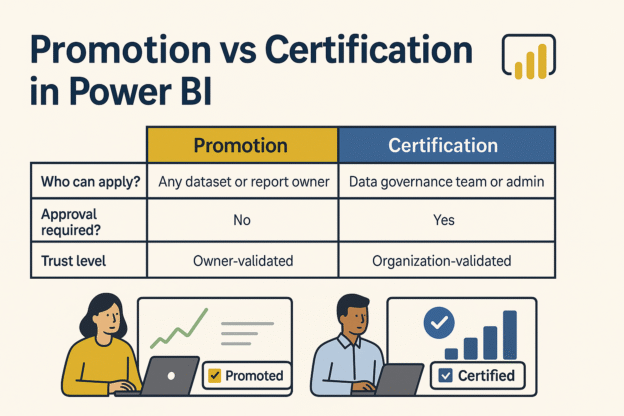
Category Archives: Data

DailyBITalks sql for data analysis

The Ultimate Guide to SQL Functions for Data Analysts

If you work with data, SQL functions are your toolkit for unlocking powerful insights. Whether you’re crafting detailed reports or uncovering business-changing analytics, SQL is the backbone for data doers in every industry. This guide explores 27 SQL functions that every data analyst, data engineer, or analytics enthusiast should know. These functions are grouped into five categories for easier understanding and practical use.

Continue reading
Conduct Tableau Predictive Analysis Functions in Time Series Visualizations dailybitalks.com

How to Conduct Tableau Predictive Analysis Functions in Time Series Visualizations

Predictive analytics is a powerful tool that transforms raw data into actionable insights, enabling data-driven decision-making. With Tableau’s predictive modeling functions, you can extend time axes, forecast trends, and identify future opportunities. This article walks you through creating predictions in Tableau and explores how to choose the right predictive model for your analysis.

Continue reading
Tableau forecasting dailybitalks.com

A Comprehensive Guide to Tableau Forecasting Methods

Forecasting is a powerful tool in analytics, allowing businesses to make data-driven predictions about future trends and performance. Tableau, a leading data visualization platform, provides robust forecasting capabilities that are easy to use yet sophisticated enough to handle complex data. By integrating statistical models directly into its visualizations, Tableau empowers users to forecast trends and display them in an intuitive manner.

Continue reading
Enabling On-Premises Data Gateway for Microsoft Fabric dailybitalks.com

Detailed Guide on Enabling On-Premises Data Gateway for Microsoft Fabric and Power BI

Microsoft Fabric’s Data Factory is a robust cloud-based data integration service that enables you to create, schedule, and manage workflows across various data sources. When dealing with data sources that reside on-premises, Microsoft offers the On-Premises Data Gateway, which provides a secure connection between your on-premises environment and the cloud.

Continue reading
How to Join Two Tables on Multiple Columns dailybitalks.com

Power BI Tips: How to Join Two Tables on Multiple Columns

Joining tables in Power BI is a common task when working with data models, especially when your tables don’t have a straightforward one-to-one relationship. Sometimes, you may need to combine two tables using multiple columns as the linking fields. This is where creating a composite key comes in handy.

Continue reading
How to Synchronize Primary and Secondary Y-Axis in Power BI dailybitalks.com

Power BI Tips: How to Synchronize Primary and Secondary Y-Axis in Power BI Line Charts

When working with Power BI line charts, you may want to display two data series with different scales using dual Y-axes (primary and secondary Y-axis). However, if the scales don’t match, it can make your chart confusing and potentially misleading. To ensure your data is accurately represented, synchronizing the Y-axes by setting consistent minimum and maximum values is key. This guide will walk you through the steps to synchronize the primary and secondary Y-axes specifically for Power BI line charts.

Continue reading
How to Extract Background Images from Power BI (PBIX) Files: A Step-by-Step Guide dailybitalks.com

How to Extract Background Images from Power BI (PBIX) Files: A Step-by-Step Guide

Power BI is a powerful tool for data visualization, and often, users integrate background images, icons, and visuals to create custom dashboards that elevate the storytelling behind the data. But what if you need to extract these images from a PBIX file? While Power BI Desktop doesn’t offer a built-in method for image extraction, there’s a clever trick that allows you to extract embedded images and backgrounds.

Continue reading
Useful Shortcuts for Power BI and Fabric dailybitalks.com

Useful Shortcuts for Power BI and Fabric

Power BI is a powerful tool for data visualization and analysis, but navigating through its various features and functionalities can sometimes be time-consuming. To enhance your productivity and make your workflow more efficient, Power BI offers several keyboard shortcuts. Whether you’re cleaning data, building visualizations, or customizing reports, these shortcuts can save you time and effort.

Continue reading
How to Convert Degree Minute Second (DMS) to Latitude and Longitude in Tableau dailybitalks.com

How to Convert Degree Minute Second (DMS) to Latitude and Longitude in Tableau

Geographic data is often stored in a Degree-Minute-Second (DMS) format, making it a bit tricky to convert into the standard decimal degrees (DD) required for Tableau’s mapping functions. In this post, I’ll walk you through how to transform DMS coordinates to decimal degrees directly in Tableau, step-by-step, so you can plot your geographic data without headaches.

Continue reading