
When analyzing sales performance, executives often ask:
“How are we performing so far this year compared to last year?”
That question can be answered easily if you know how to calculate Year-to-Date (YTD) values in Power BI.
YTD is one of the most common business intelligence metrics, helping you see cumulative results from the start of the year up to today’s date. In this guide, we’ll show you exactly how to calculate YTD in Power BI using the popular Superstore dataset, step-by-step — with explanations, DAX examples, visuals, and best practices.
What Does “Year-to-Date” Mean?
Year-to-Date (YTD) measures the total of a metric — such as Sales, Profit, or Quantity — from the first day of the year through the current date.
For example:
- If today is July 15, 2025, YTD Sales means all sales from January 1, 2025 to July 15, 2025.
- If you select 2024 in a slicer, it shows cumulative values from January 1, 2024 to December 31, 2024 (or the latest available date).
YTD reporting helps you evaluate current progress, compare performance year-over-year, and identify growth trends.
Prerequisites: Building a Date Table
To make time intelligence functions like YTD work correctly, you must have a Date Table (Calendar Table) in your Power BI model.
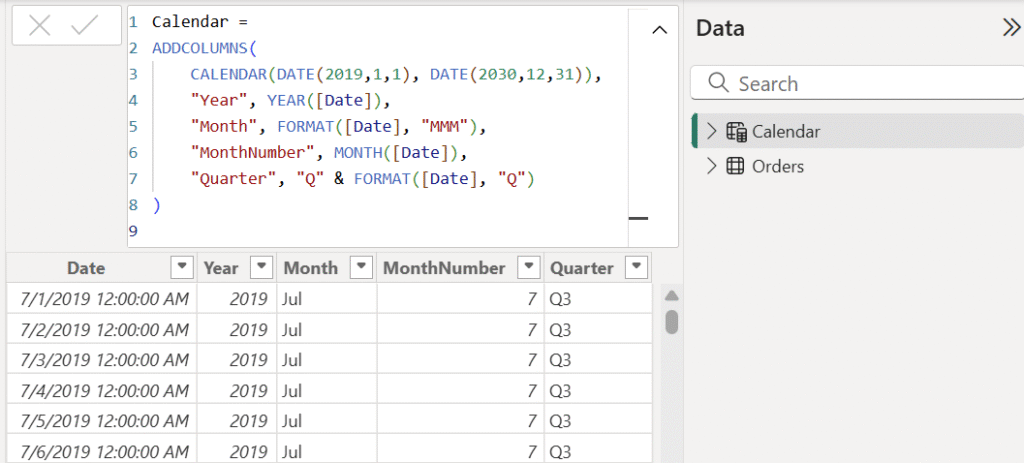
You can create it easily using DAX:
Calendar =
ADDCOLUMNS(
    CALENDAR(DATE(2019,1,1), DATE(2025,12,31)),
    "Year", YEAR([Date]),
    "Month", FORMAT([Date], "MMM"),
    "MonthNumber", MONTH([Date]),
    "Quarter", "Q" & FORMAT([Date], "Q")
)
Then:
- Mark this table as a Date Table in Power BI (Model view → right-click table → Mark as Date Table).
- Create a relationship between
Calendar[Date]andOrders[Order Date]in the Superstore dataset.
Step 1: Create a Base Measure
Let’s start by defining a simple Sales measure.
Total Sales = SUM(Orders[Sales])
This gives the total sales amount across all dates.
You’ll use this measure as the foundation for the YTD calculation.
Step 2: Create a Year-to-Date (YTD) Measure
There are two popular DAX methods for calculating YTD:
Method 1 — Using TOTALYTD()
This is the easiest way to create a YTD measure.
Sales YTD =
TOTALYTD(
    [Total Sales],
    'Calendar'[Date]
)
This tells Power BI:
“Take my Total Sales measure, and accumulate it from the start of the year up to the current date.”
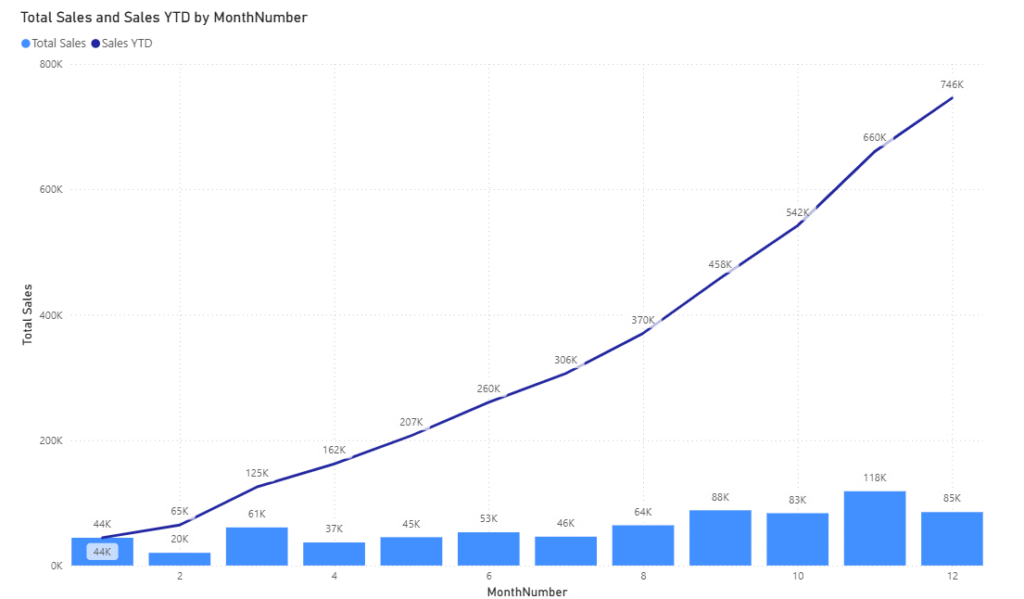
Now, if you place Calendar[Month] on the x-axis and Sales YTD as a line chart, you’ll see the sales building up month-by-month.
💡 Example:
In the Superstore dataset, if you plot data for 2021, the line will rise steadily through the year, reaching its peak at December.
Method 2 — Using CALCULATE() + DATESYTD()
If you prefer more control or plan to modify filters later, use this pattern:
Sales YTD (Alt) =
CALCULATE(
    [Total Sales],
    DATESYTD('Calendar'[Date])
)
Both methods return the same result, but the CALCULATE() approach is more flexible if you need to add custom conditions later (e.g., only specific product categories).
Step 3: Create a Previous Year YTD (YoY Comparison)
To compare current year vs. previous year, add another measure:
Sales PYTD =
CALCULATE(
    [Sales YTD],
    SAMEPERIODLASTYEAR('Calendar'[Date])
)
Now you can easily visualize year-over-year growth by plotting:
Sales YTD(current year)Sales PYTD(previous year)
Then, add a final measure for the percentage difference:
YTD Growth % =
DIVIDE(
    [Sales YTD] - [Sales PYTD],
    [Sales PYTD]
)
You’ll see how sales are trending relative to last year — a key insight for management dashboards.
Step 4: Handle Fiscal Years (Optional)
If your company’s fiscal year doesn’t start on January 1, use the third argument in TOTALYTD():
Sales FYTD =
TOTALYTD(
    [Total Sales],
    'Calendar'[Date],
    "06-30"   // Fiscal year ends June 30
)
This adjusts YTD calculations to start from July 1 and end on June 30, aligning with fiscal periods.
Step 5: Verify with Visuals
In Power BI, create a line and clustered column chart:
- X-axis:
Calendar[Month] - Columns:
[Total Sales] - Line:
[Sales YTD]
You’ll see cumulative sales growing through the year. Add a slicer for Calendar[Year] to toggle between years and observe how YTD resets on January 1 of each selected year.
Example (Superstore):
If total 2023 sales = $748,000, then:
- YTD for March = $125,000
- YTD for June = $260,000
- YTD for December = $748,000
Step 6: Common Pitfalls & Fixes
| Issue | Why It Happens | Solution |
|---|---|---|
| YTD shows wrong totals across years | Calendar table not marked as Date Table | Right-click → Mark as Date Table |
| YTD continues after current date | Calendar extends beyond data | Limit calendar to MAX(Order Date) |
| YTD not resetting | Missing relationship between Calendar and Orders | Check model relationships |
| Fiscal year mismatch | Default Jan–Dec logic used | Use TOTALYTD([Measure], Date, "06-30") |
Step 7: Optional SQL Approach (for ETL or Pre-Aggregated Tables)
If you’re preparing your data in SQL before loading into Power BI, you can calculate YTD at the source level:
SELECT
    OrderDate,
    CustomerName,
    SUM(Sales) OVER (
        PARTITION BY YEAR(OrderDate)
        ORDER BY OrderDate
        ROWS BETWEEN UNBOUNDED PRECEDING AND CURRENT ROW
    ) AS SalesYTD
FROM Orders;
However, for most analysts, the DAX approach is preferred because it allows dynamic filtering, drill-downs, and faster iteration.
Step 8: Combine YTD with Other Metrics
You can easily apply the same logic to:
- Profit YTD – use
[Total Profit] = SUM(Orders[Profit]) - Quantity YTD – use
[Total Quantity] = SUM(Orders[Quantity]) - Customer Count YTD – use
DISTINCTCOUNT(Orders[Customer Name])
This lets you create comprehensive performance dashboards with consistent cumulative logic.
Best Practices for YTD in Power BI
- Always use a Date Table and mark it correctly.
- Create base measures first, then build YTD measures from them.
- Use TOTALYTD for simplicity; use
CALCULATE + DATESYTDwhen adding filters. - Test fiscal year handling if your year doesn’t start in January.
- Visualize with context — cumulative charts + YoY comparisons.
- Validate your totals at month and year-end to ensure accuracy.
Conclusion
Calculating Year-to-Date (YTD) in Power BI is a core analytical skill for any BI professional. With a solid date table, clean data model, and the right DAX functions (TOTALYTD or DATESYTD), you can create dynamic, accurate, and interactive YTD visuals in minutes.
Using the Superstore dataset makes learning intuitive — you can visualize cumulative sales, profit, and customer trends with just a few lines of DAX.
Once you’ve mastered YTD, try expanding into Month-to-Date (MTD) and Quarter-to-Date (QTD) for more granular insights.
Discover more from Daily BI Talks
Subscribe to get the latest posts sent to your email.