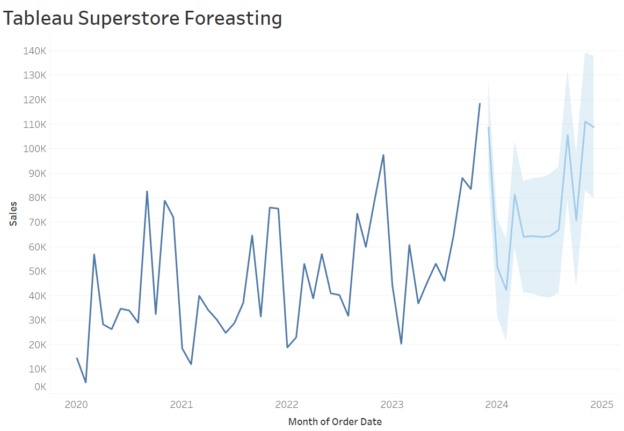
Tag Archives: Tableau

dailybitalks.com The Complete Likert Scale and NPS Tableau Tutorial

The Complete Likert Scale and NPS Tableau Tutorial(Part 2)

Be sure to check out my previous article on creating a Likert scale, as we’ll be using the same restaurant survey dataset. However, we won’t be using any of the calculated fields from the Likert scale, so feel free to skip it if you’d like. That said, the final dashboard will feature both the Likert and NPS charts side by side—they always pair well together, don’t you think?

Continue reading
dailybitalks.com The Complete Likert Scale and NPS Tableau Tutorial

The Complete Likert Scale and NPS Tableau Tutorial(Part 1)

Surveys are powerful tools for gathering feedback and insights, with Likert scales and Net Promoter Score (NPS) being two popular methods for measuring attitudes, opinions, and customer satisfaction. Likert scales assess the level of agreement or disagreement on a statement, while NPS measures customer loyalty by asking how likely respondents are to recommend a product or service.

Continue reading
dailybitalks.com tableau row-level security

How to Set Row-Level Security in Tableau Using Dynamic User Filters

Ensuring data security and privacy is paramount when dealing with business intelligence and analytics. Tableau, a leading data visualization tool, offers robust features to manage data security effectively. One such feature is Row-Level Security (RLS), which restricts data access for different users based on their roles or attributes. This blog post will guide you through setting up Row-Level Security in Tableau using dynamic user filters.

Continue reading
dailybitalks.com report optimization

13 Tips on Optimizing Your Tableau Report!

Creating a visually appealing and efficient Tableau report is crucial for making data-driven decisions. However, as your data grows, your reports might start to lag, leading to frustration and inefficiency. In this blog post, we will explore how to optimize your Tableau reports from three key perspectives: data sources, individual visualizations, and dashboards. By following these tips, you can ensure your reports run smoothly and deliver insights effectively.

Continue reading
DailyBITalks Tableau Fixed LOD

Tableau to Power BI : How to Use Tableau Fixed LOD in Power BI

If you’ve navigated Tableau’s powerful Level of Detail (LOD) function, you know its complexity and potential for creating impactful visualizations. Now, whether you’re transitioning from Tableau to Power BI or need to excel in both platforms with limited Power BI skills, fear not! In this series, we’ll unravel the mysteries of applying Tableau’s three main LOD functions in Power BI.

Continue reading
Tableau to Power BI --- How to Convert If/Else to Dax Switch Function

Tableau to Power BI — How to Convert If/Else to Dax Switch Function

If/esleif/else is one of the the most used functions in Tableau calculation and unfortunately, it can not be applied verbatim in Power BI to achieve the same goal. The equivalent function in Power BI DAX language is the Switch() function and it works especially well on multiple scenarios, it can be used to convert either if/elseif/else statement of possibly case/when query in Tableau.

Continue reading