
Imagine you launch a new checkout banner promising free shipping. It feels good, it looks good—but does it actually boost purchases?
This is where A/B testing in e-commerce shines. By splitting users into two groups and measuring outcomes, analysts can turn small design choices into measurable business impact. In this guide, we’ll walk through a checkout conversion case study, complete with charts and statistical testing, tailored for data and business analysts.
Core Concepts & Metrics Every Analyst Should Know
Before diving into a real-world scenario, let’s refresh the foundational language of experimentation.
- A (Control): the current experience.
- B (Variant): the new feature or design.
- Goal: compare the conversion rates between groups, and decide whether the difference is real or random noise.
- Null Hypothesis (H₀): There is no difference between Control and Variant.
- Alternative Hypothesis (H₁): The Variant truly impacts the metric (positively or negatively).
- p-value: Probability of observing results at least as extreme as the current test, if H₀ were true.
- Significance Level (α): Commonly 0.05. If p < α, we reject H₀.
- Confidence Interval (CI): A range of plausible values for the effect. A 95% CI means: in repeated experiments, 95% of such intervals would contain the true effect.
- Effect Size: The magnitude of difference between Control and Variant (e.g., +0.6 percentage points in conversion).
- Statistical Power: Probability that a test correctly detects a true effect (commonly 80%).
- Minimum Detectable Effect (MDE): The smallest lift you care about detecting—what’s practically meaningful for the business.
- Primary KPI: The main metric under test (e.g., conversion rate).
- Guardrail Metrics: Secondary metrics to ensure no harm (e.g., average order value, site speed).
Analyst takeaway: Always align MDE with business economics. A “statistically significant” +0.1% may be worthless—or a +0.5% may drive millions.
Use Case: The Checkout Banner Experiment
Business Question: Will showing a free-shipping banner increase purchase conversions at checkout?
- Hypothesis: The banner increases conversion rate.
- Primary KPI: Conversion rate = orders ÷ sessions.
- Guardrails: Average order value (AOV), refund rate, site speed.
Design:
- Randomly assign sessions to Control (no banner) or Variant (banner).
- Run for at least 2 full business cycles.
- Define a minimum detectable effect (MDE), e.g. +0.5 percentage points.
Results: Synthetic E-commerce Test
We simulated 30 days of data with ~8,000 sessions per group per day.
- Control conversion: 3.5%
- Variant conversion: 4.1% (+0.6 pp uplift, statistically significant)
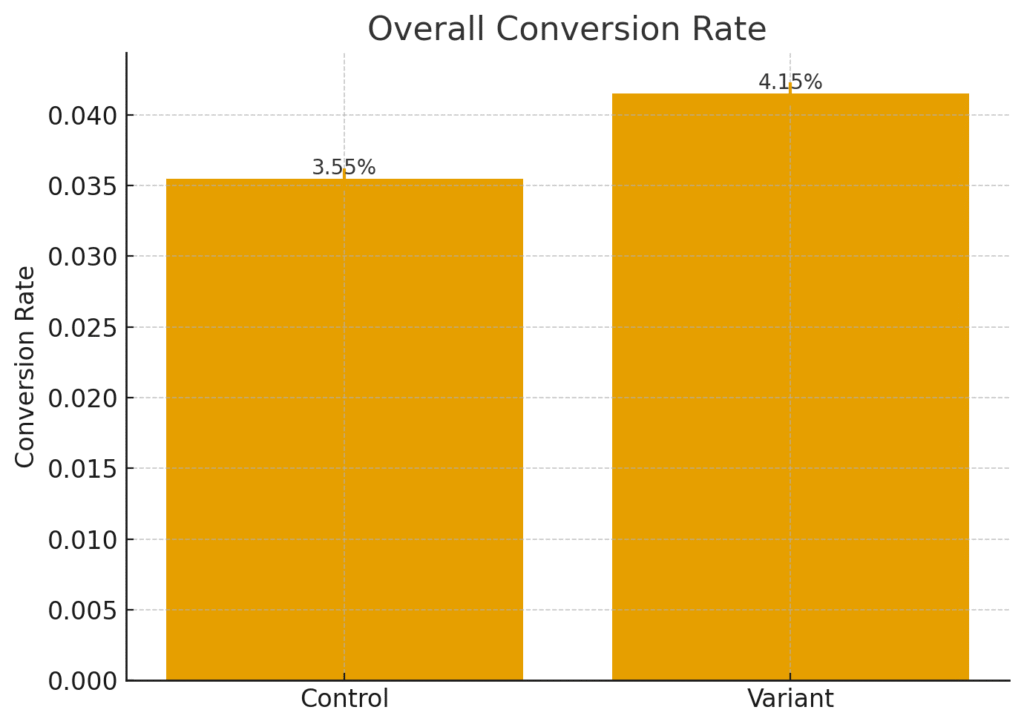
This bar chart shows Control vs Variant conversion rates with 95% confidence intervals. The uplift is visible, and the intervals don’t overlap, suggesting the variant’s improvement is unlikely due to chance.
Conversion Over Time: Spotting Stability
Looking at daily rates reveals whether uplift is stable or just a temporary novelty spike.
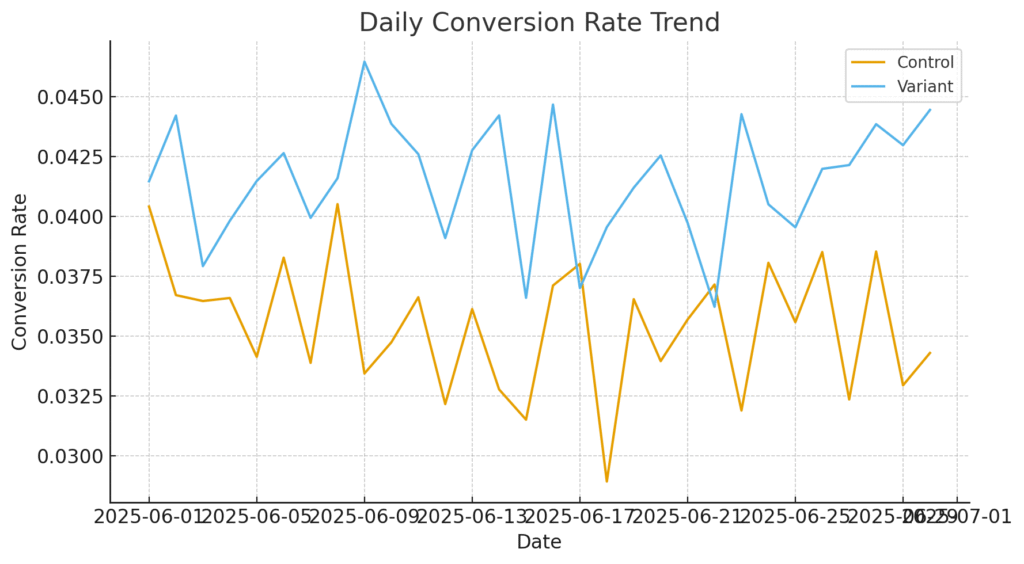
Notice how the Variant line consistently tracks above Control. This pattern suggests the banner’s effect is durable, not a one-day anomaly.
Analyst insight: Always check temporal trends. If uplift only appears on weekends or early days, it may not generalize.
Sample Size & Power: Planning for Success
A frequent analyst pitfall: running tests with too little data. This produces inconclusive results that frustrate business stakeholders.
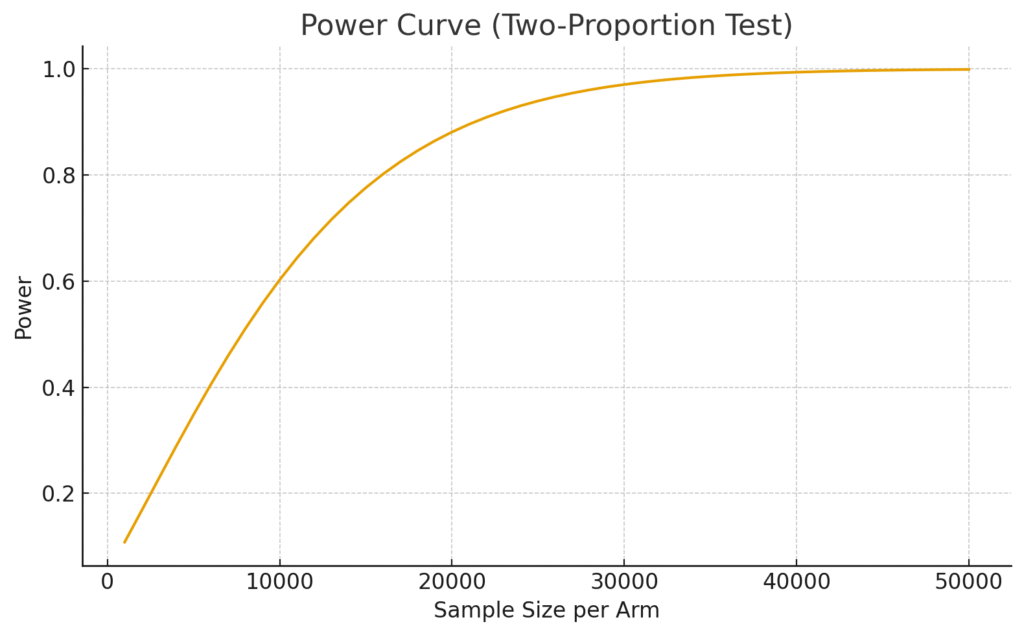
This chart shows how test power increases with sample size. With our uplift (+0.6 pp), ~20,000 users per arm achieve ~80% power.
Tip: Always calculate required sample size in advance. Underpowered tests waste resources and mislead decisions.
Understanding P-values: Why They Can Mislead
P-values tell us how unusual results are if there were no true effect. But by chance, ~5% of null tests still return p < 0.05.
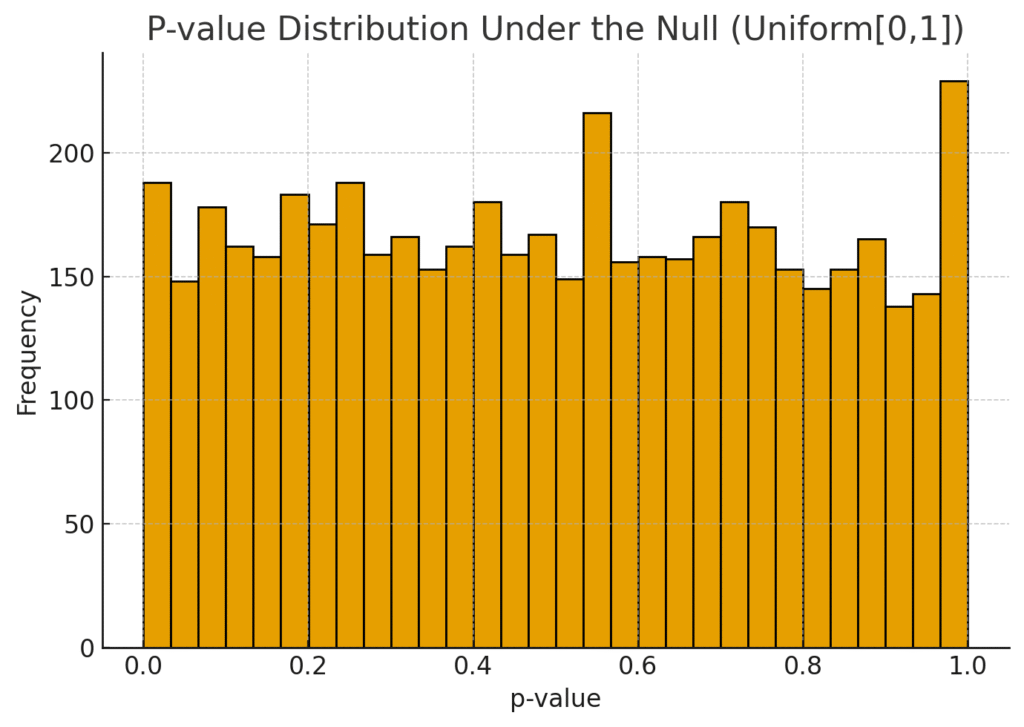
This histogram illustrates why multiple testing or peeking mid-test is dangerous. Even with no effect, false positives occur regularly.
Analyst insight: Always combine p-values with effect sizes and CIs. Report the business impact, not just “it’s significant.”
Analyst’s Checklist for E-commerce A/B Tests
- ✅ Pre-register hypothesis, metrics, and MDE.
- ✅ Validate randomization and data logging.
- ✅ Track guardrail KPIs alongside primary KPI.
- ✅ Report effect size, confidence intervals, and business impact.
- ✅ Document outcomes—even negative results prevent repeating mistakes.
Common Pitfalls to Avoid
- Stopping early: Resist the urge to call results mid-test.
- Multiple variants without correction: Use Bonferroni, Holm, or FDR adjustments.
- Novelty effect: Let the test run long enough for behavior to stabilize.
- Wrong KPI: Always align with business goals (revenue, margin).
From Results to Action
The simulated free-shipping banner experiment showed a clear uplift: +0.6 pp conversion. For a retailer with 10M annual sessions, that’s 60,000 extra orders—a massive revenue boost.
This illustrates the power of A/B testing in e-commerce: turning small design choices into validated business wins.
Final Thought
For analysts, A/B testing is more than statistics—it’s strategic decision-making. By designing tests well, visualizing results clearly, and communicating in business terms, you become the bridge between data and impact.
Discover more from Daily BI Talks
Subscribe to get the latest posts sent to your email.